Uncover and fix costly sales pipeline inefficiencies. This guide provides a data-backed framework to diagnose issues and boost revenue for B2B SaaS companies.
Your sales pipeline might look packed, but is it actually working? For many B2B SaaS and fintech companies scaling past the €8–10M ARR mark, the honest answer is a frustrating "no." The problem isn't your sales team's hustle; it's the silent revenue killer known as sales pipeline inefficiencies.
Think of your pipeline as a bucket designed to carry water (your revenue). Inefficiencies are the small, almost invisible leaks in that bucket.

An overturned bucket spills numerous receipts on a desk, with a laptop and 'FIX THE LEAKS' text.
A single drip seems harmless. But over time, dozens of these tiny leaks—a delayed follow-up here, a poorly qualified lead there, a sloppy CRM handoff—add up to a massive loss. Before you know it, you're losing deals you should have won, your sales cycle is stretching out, and your forecasts are just wishful thinking.
The Gap Between Perception and Reality
This issue is everywhere, especially as companies grow. A staggering 61% of sales teams are fighting inaccurate forecasting and messy pipeline management. For founders and RevOps leaders, the pain is often made worse by disconnected systems, with 53% of SMBs admitting that data inconsistencies are gumming up their entire operation, as highlighted in a comprehensive Salesforce report on 2025 trends.
The root of the problem is the gap between what you think is happening and what your data actually shows. You see a flurry of activity and assume progress, but the numbers tell a very different story. One of the first things we uncover in our diagnostic audits is this disconnect. Leaders often have a gut feeling about their pipeline's health, but the raw data is a real wake-up call.
Perception vs. Reality: Common Gaps in Sales Pipelines
| Metric | Common Perception | Data-Driven Reality (Based on Client Audits) |
|---|---|---|
| Lead Response Time | "We follow up on all hot leads within a day." | "Data shows your average response time is 38 hours, with 25% of MQLs never getting a response at all." |
| Pipeline Coverage | "Our pipeline is strong; we have 4x coverage for the quarter." | "30% of your pipeline is 'stale' (no activity in 30+ days), so real coverage is closer to 2.8x." |
| Conversion Rates | "Our reps are great closers; our win rates are solid." | "Win rates vary by 45% between top and bottom performers, indicating a process problem, not just a skill gap." |
| CRM Data Quality | "Our CRM is our source of truth." | "Only 70% of opportunities have a clearly defined next step, and 40% have inaccurate close dates." |
This gap isn't just an academic exercise—it leads to real business pain:
- •Longer Sales Cycles: Deals that should close in 60 days drag on for 90 or even 120 because of internal friction.
- •Wasted Rep Time: Your best salespeople end up spending hours chasing ghost deals or fighting broken systems instead of selling.
- •Unreliable Forecasting: Without a clean, data-backed view of the pipeline, predicting revenue becomes a guessing game.
Fixing these sales pipeline inefficiencies isn't about telling your team to work harder. It’s about building smarter, transparent systems that reveal the truth, plug the leaks, and create a truly predictable engine for growth.
Five Critical Metrics to Diagnose Pipeline Health
You can't fix a leaky pipeline if you don't know where the holes are. To move from guesswork to a data-driven diagnosis, you have to focus on the handful of vital signs that reveal the true health of your revenue engine. Instead of getting lost in dozens of vanity metrics, start with these five.
These aren't just numbers on a dashboard; they are the ground truth that shows you precisely where your process is breaking down. For an €8–10M ARR business, mastering them is the first real step toward building a predictable growth machine.
Lead-to-Opportunity Conversion Rate
This is your first critical checkpoint. What percentage of marketing-qualified leads (MQLs) does your sales team actually accept and turn into a legitimate sales opportunity? A low number here is a massive red flag, usually pointing to a serious misalignment between sales and marketing.
It tells you one of two things is happening: either marketing is sending over poorly qualified leads, or your sales team isn't effectively working the leads they get. HubSpot suggests a healthy benchmark for B2B SaaS is around 13%, but a shocking number of companies fall far short of this. Understanding the right KPIs for lead generation is non-negotiable for getting this stage right.
Sales Cycle Length
How long does it take to turn a qualified opportunity into a closed-won deal? Your average sales cycle length is a direct measure of your pipeline's efficiency—or friction. A long or, even worse, lengthening sales cycle is a classic symptom of sales pipeline inefficiencies, tying up your reps' time and pushing revenue further down the road.
A typical B2B sales cycle for a mid-market SaaS product is around 84 days according to industry benchmarks from ChartMogul. If yours is creeping toward 90 days or more, it’s a sign that deals are getting stuck. This could be due to a fuzzy value proposition, a lack of urgency, or internal bottlenecks in your own contracting process. You have to find out where deals are stalling to get things flowing again.
Lead Response Time
In B2B sales, speed wins. Period. This metric measures how quickly your team follows up with an inbound lead, and the data is brutal: the odds of connecting with a lead plummet after the first five minutes. Yet, many teams still operate with response time SLAs measured in hours, or even days.
As James Buckley, a RevOps leader, often says, "A slow response is perceived as a lack of interest. The system you build to enable speed is your first competitive advantage." A Gartner report backs this up, highlighting that sellers who respond quickly are 7x more likely to have a meaningful conversation with a decision-maker.
Pipeline Coverage Ratio
This metric answers a simple but vital question: do you have enough qualified pipeline to actually hit your revenue target? Pipeline coverage is the ratio of your total open pipeline value to your quarterly quota. A healthy benchmark for a growing SaaS company is typically between 3x and 4x your quarterly target.
For example, if your quarterly goal is €500k, you need to be looking at a qualified pipeline of at least €1.5M. Anything less than 3x coverage means your team is under immense pressure, and a single lost deal could put the entire quarter at risk. For a deeper dive into what to measure, check out our guide on essential KPI tracking for growth.
Deal Win Rate
Finally, your win rate is the ultimate report card for sales effectiveness. Calculated as the number of closed-won deals divided by the total number of qualified opportunities, it tells you how well your team converts real chances into real revenue.
A common win rate for B2B companies hovers around 20-30%. If your win rate is slipping, it could signal issues with pricing or competitive pressures. But more often than not, it points to internal problems—like a broken discovery process or reps wasting time on deals that were never going to close in the first place.
Identifying the Root Causes of Pipeline Bottlenecks
Knowing what's broken in your pipeline is the first step. Understanding why is where the real work begins. The metrics you've just diagnosed—like a painfully slow sales cycle—are just symptoms. It's time to trace those symptoms back to the underlying disease.
Most pipeline problems stem from a handful of core operational failures. By tracking a bad number back to its source, you can stop patching leaks and finally fix the faulty plumbing for good.
For instance, a lead response time creeping past 24 hours isn't just a "sales problem." It's a process failure, very likely caused by new leads being manually assigned only once a day. These root causes almost always fall into four distinct categories.
Flawed Processes and Vague Definitions
This is, by far, the most common culprit. When the rules of engagement are fuzzy, chaos is guaranteed.
This usually looks like a complete disconnect between what Marketing considers a "good lead" and what Sales is actually willing to work. Without crystal-clear, mutually agreed-upon criteria for MQLs (Marketing Qualified Leads) and SQLs (Sales Qualified Leads), you create massive friction at the most critical handoff point.
A major bottleneck here is poor lead qualification. Learning how to qualify sales leads and stop wasting time is crucial to prevent reps from chasing ghosts—deals that were never going to close. This misalignment directly torpedoes your lead-to-opportunity conversion rates and burns through your reps' most valuable asset: their time.
This diagram shows just how interconnected your core metrics are. A problem in one area always creates a ripple effect elsewhere.
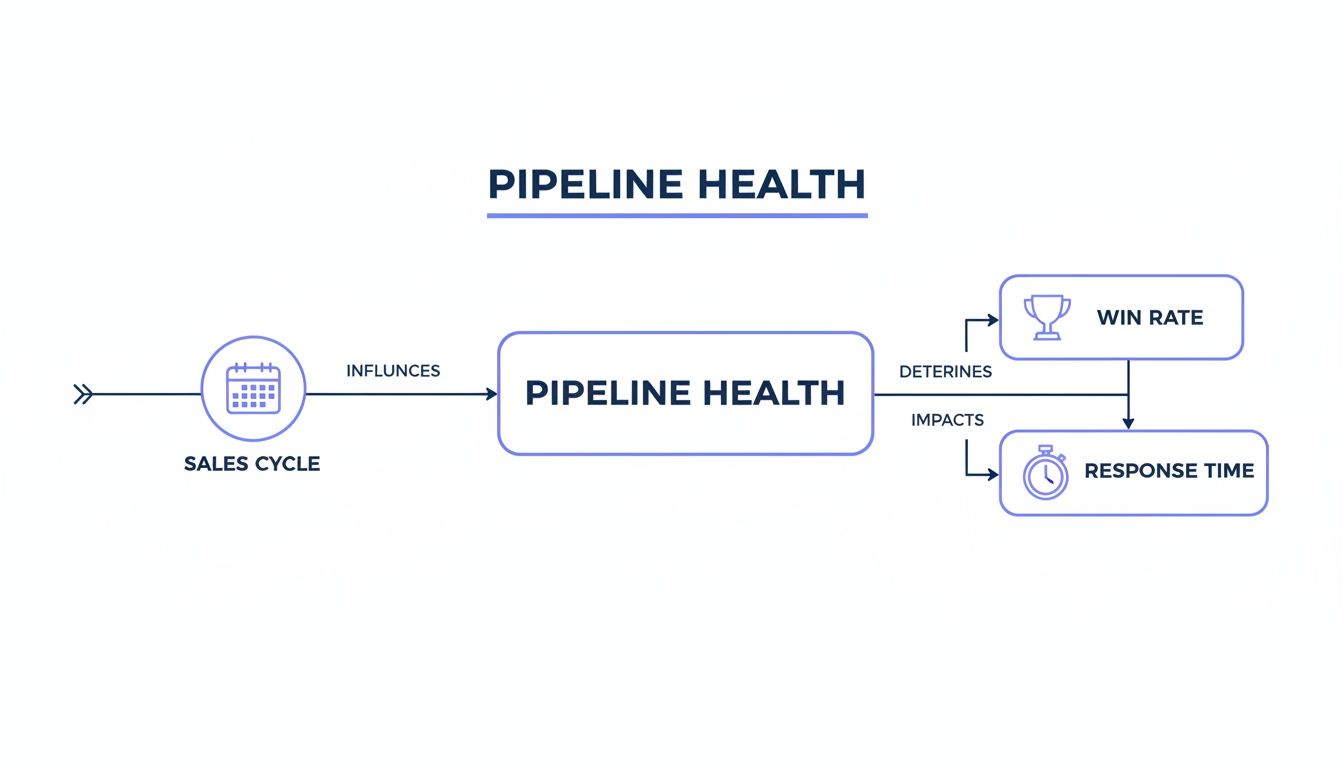
A flowchart illustrating how Sales Cycle influences Pipeline Health, which determines Win Rate and impacts Response Time.
As you can see, a delay in response time doesn't just annoy a prospect; it directly drags down your win rate and stretches out your entire sales cycle.
Broken Automation and Faulty Routing
Your tech stack is supposed to be an accelerator, not an anchor. Broken automation is a silent killer of pipeline velocity. It can be a faulty lead routing rule in your CRM that sends a high-intent demo request to an unmonitored inbox. We see this all the time.
Another classic failure is the lack of automated follow-up sequences. When a prospect downloads a whitepaper, your system should trigger an immediate, relevant touchpoint. If it doesn't, you're relying on manual effort, which is inconsistent at best. This directly crushes your lead response time and lets warm leads go ice-cold. AI can amplify your team’s efforts here, not by creating noise, but by ensuring the right process is followed, every single time.
According to Forrester, companies that master lead nurturing generate 50% more sales-ready leads at a 33% lower cost. When your automation fails, you're not just moving slower—you're leaving money on the table.
Poor Data Hygiene and Inconsistent Updates
A leaky pipeline is almost always built on a foundation of messy data. If your sales team isn't consistently updating deal stages, close dates, and next steps in the CRM, your forecast becomes a work of fiction. This isn't just about reps being lazy; it's often a sign that your process is too clunky.
This problem is rampant. A recent finding shows a shocking 75% of companies lack the right tools for complex sales processes. Our own audits frequently uncover reps losing 40% of their time to manual data entry—time they should be spending selling.
Lack of Clear Ownership and Accountability
Finally, the simplest question: who owns each step? When a lead gets passed from marketing to sales, is there a defined Service Level Agreement (SLA) for that first follow-up? Who is ultimately responsible for making sure the data in the CRM is accurate? Without clear owners, critical tasks fall through the cracks. Every. Single. Time.
This ambiguity creates bottlenecks at every handoff. For instance, if nobody is assigned to nurture leads that aren't quite sales-ready, they get tossed into a "lead graveyard" and are forgotten forever. Defining ownership isn't about micromanagement; it's about building a system where everyone knows their exact role in moving a deal forward.
To get a better handle on the data behind these processes, you can dig deeper into the essentials of sales analytics.
Mapping Symptoms to Their Root Causes
To help you connect the dots, this table maps the common pipeline symptoms to their likely underlying causes. Use it as a diagnostic tool to trace the problem back to its source.
| Symptom (Metric) | Potential Root Cause | Affected Area |
|---|---|---|
| Low Conversion Rates | Poor MQL/SQL definitions; Ineffective lead qualification; Reps lack product knowledge | Marketing & Sales |
| Long Sales Cycle | No follow-up process; Inconsistent deal stage definitions; Lack of urgency in deals | Sales & Enablement |
| Low Pipeline Coverage | Insufficient lead volume; Reps bogged down by admin tasks; Poor prospecting skills | Marketing & Sales |
| Slow Lead Response Time | Manual lead routing; No lead assignment SLA; Broken automation | Marketing Ops & Sales |
| High Follow-Up Failure | No automated nurture sequences; Lack of clear "next steps" in the sales process | Sales Ops & Marketing |
| Inaccurate Forecasting | Poor CRM data hygiene; No clear ownership for data updates; Vague deal stage criteria | Sales & RevOps |
By identifying not just the symptom but the specific root cause and the teams involved, you can move from firefighting to building a truly resilient revenue engine.
A Prioritized Roadmap to Fix Your Leaky Pipeline
Knowing why your pipeline is leaking is one thing; knowing where to start fixing it is a completely different ballgame. The most common mistake we see is trying to boil the ocean—tackling every problem at once, only to make zero meaningful progress.
The key is ruthless prioritization. You need a simple framework: impact versus effort.

A priority roadmap on a whiteboard with colorful sticky notes, indicating progress.
This means you start with the low-effort, high-impact wins. These are the fixes that deliver immediate results and build momentum. For instance, setting up automated round-robin lead routing is a quick technical fix that can immediately slash your lead response time. It’s all about making smart, sequential changes that compound over time.
This roadmap is built on four essential pillars. By tackling each one methodically, you can systematically plug the leaks and build a far more resilient revenue engine.
Pillar 1: Process Refinement
Your processes are the guardrails of your entire GTM motion. When they're vague, your team is flying blind. The very first step is to bring absolute clarity to the most critical handoff in your business: Marketing to Sales.
This starts by defining—and documenting—your MQL (Marketing Qualified Lead) and SQL (Sales Qualified Lead) criteria. This isn’t some theoretical exercise; it’s a non-negotiable handshake between teams.
- •Actionable MQL Criteria: Go beyond basic demographics. A strong MQL definition must include firmographic data (e.g., industry, company size), behavioral data (e.g., visited the pricing page), and any intent data signals you have.
- •Concrete SQL Criteria: What makes a lead genuinely "sales-ready"? A classic framework like BANT (Budget, Authority, Need, Timeline) works well here. The rule? Sales should only accept leads where at least two of these criteria are confirmed.
Just this one act of defining terms eliminates the friction that causes so many qualified leads to be dropped or ignored. You'll see a direct impact on your lead-to-opportunity conversion rate.
Pillar 2: Tooling and Automation
Your tech stack should be an accelerator, not a brake pedal. The goal here is to automate the repetitive, low-value tasks that bog down your sales reps. Focus your efforts on workflows that directly address the bottlenecks you’ve already identified.
According to Salesforce, sales reps spend only about 28% of their week actually selling. The rest is eaten up by admin tasks. Automation gives that time back.
A few key automation wins to target first:
- •Automated Lead Routing: As mentioned, set up rules in your CRM to instantly assign new leads to the right rep based on territory, industry, or workload.
- •Task Creation Workflows: When a deal moves to a new stage, automatically create a follow-up task for the rep. This ensures no opportunity is ever forgotten.
- •Data Hygiene Alerts: Create simple alerts that ping a rep or manager when a critical field (like "Next Step Date") is missing on a late-stage deal.
Pillar 3: Ownership and Accountability
A process without an owner is just a suggestion on a forgotten Google Doc. For this roadmap to stick, every action must have a single, clearly assigned owner and a defined Service Level Agreement (SLA). Accountability is what turns good intentions into consistent execution.
For example, who is responsible for updating a deal stage from "Discovery" to "Proposal"? The Account Executive. What's the SLA for the first follow-up call after a lead is assigned? Two hours. No exceptions.
These aren't meant to be punitive. SLAs create a culture of clarity and performance, making sure everyone understands their role in moving a deal forward. This directly attacks issues like stalled deals and inconsistent follow-ups.
Pillar 4: Data and Reporting
Finally, you have to measure what you've fixed. This last pillar is all about building a simple, shared dashboard that tracks the key metrics you diagnosed earlier. This isn't for the executive team; it’s for the front-line reps and managers who need to see the impact of their work in real-time.
Your "Pipeline Health Dashboard" becomes your single source of truth, monitoring:
- •Lead Response Time (by rep)
- •Lead-to-Opportunity Conversion Rate (this week vs. last week)
- •Average Sales Cycle Length
- •Active Pipeline Coverage Ratio
This dashboard closes the loop, showing you which fixes are working and where you need to adjust. This ongoing measurement is a core principle of effective funnel optimization, transforming your pipeline from a black box into a transparent, predictable system.
By tackling these four pillars in a prioritized way, you can move from a reactive, chaotic sales motion to a proactive, predictable one. Expect a 15-25% improvement in pipeline velocity within 6 weeks.
Sample 30-Day Implementation Timeline
- •Week 1: Audit & Align. Hold a joint Sales and Marketing workshop to define and document MQL/SQL criteria. Build the initial "Pipeline Health Dashboard" to establish a baseline. Success = MQL/SQL definitions signed off by both heads of department.
- •Week 2: Implement Quick Wins. Configure and launch automated lead routing. Set up basic task-creation workflows in the CRM for stage changes. Success = 95% of new leads are auto-routed within 5 minutes.
- •Week 3: Define Ownership. Document and communicate SLAs for lead follow-up and CRM data hygiene. Assign owners for each key stage of the sales process. Success = All reps have signed off on understanding the new SLAs.
- •Week 4: Review & Refine. Review the dashboard to measure the initial impact of your changes. Identify the next bottleneck to tackle in the following 30 days. Success = 10% reduction in average lead response time.
Real-World Examples from B2B SaaS and Fintech
Theory is one thing, but seeing it work is another. How does this kind of diagnostic and repair work play out for actual B2B SaaS and fintech companies?
We've pulled these examples from real-world scenarios we see all the time. They prove how a sharp, data-backed approach can turn a chaotic pipeline into a predictable growth machine. It’s almost always small, targeted fixes that unlock massive impact.
Case Study 1: The Sales Cycle Slasher
A €9M ARR fintech company was drowning in a bloated sales cycle. Deals that should have taken 60 days were dragging out to 85 days or more. It was eating up rep time and turning their revenue forecast into a shot in the dark.
- •
The Problem: At first glance, their lead-to-opportunity conversion rate looked great. But the reality was that sales reps were accepting nearly every lead from marketing. The pipeline was clogged with prospects who had no budget, no authority, and no immediate need. Reps were burning weeks on discovery calls and demos for deals that were dead on arrival.
- •
The Fix: We helped them implement a strict lead qualification framework based on the BANT model (Budget, Authority, Need, Timeline). Marketing was now responsible for pre-qualifying leads against at least two of those criteria. Sales got a new SLA: disqualify any lead that didn't meet the threshold within 48 hours. No exceptions.
- •
The Outcome: The results were immediate. We helped this client reduce their sales cycle from 85 days down to 60 days in a single quarter. And while the sheer number of opportunities in their pipeline dropped, the quality went through the roof, driving a 12% increase in their overall win rate.
Case Study 2: The Conversion Rate Catalyst
A B2B SaaS provider in the project management space couldn't figure out why their trial-to-paid conversion rate was stuck. It had flatlined at a dismal 8%, even with a healthy flow of new sign-ups. Their pipeline looked full at the top but was leaking cash before a sales conversation even happened.
- •
The Problem: A quick diagnostic uncovered a huge gap in their follow-up process. High-intent trial users—the ones inviting teammates or using key features—were getting the same generic email sequence as someone who logged in once. There was zero prioritization and no timely, personal outreach.
- •
The Fix: Using their existing marketing automation tool, they built a simple lead scoring model to flag "Product Qualified Leads" (PQLs) in real-time. The moment a user hit a certain activity score, an automated workflow instantly alerted the assigned rep and kicked off a targeted, personalized follow-up sequence.
- •
The Outcome: This one automation change had an outsized impact. The company increased its trial-to-paid conversion from 8% to 11.5% in just 6 weeks—that’s a 43% improvement. It was a masterclass in how fixing a single process leak can directly lift revenue without adding a single new lead.
"AI and automation aren't just for enterprise giants. For scale-ups, they're the most efficient way to enforce your best processes at scale, ensuring every high-value lead gets the attention it deserves. AI amplifies the truth in your system, not the noise."
These cases get to the heart of what we believe at Altior: fixing sales pipeline inefficiencies isn't about working harder. It’s about building smarter systems that give you the clarity to act on what's actually happening in your funnel.
Building a Foundation for Predictable Growth
Fixing individual leaks in your pipeline is a critical first step. But the real goal is to build a system that prevents them from springing up in the first place.
Overcoming sales pipeline inefficiencies isn't about asking your team to work harder or faster. It’s about implementing smarter systems that create clarity and reveal the truth in your data. It’s about moving from a culture of reactive firefighting to one of proactive, predictable growth.
The diagnostic metrics and remediation frameworks we’ve covered are more than just repair tools. They're the essential building blocks for a scalable revenue engine.
From Guesswork to a Growth Blueprint
Think of metrics like lead response time and sales cycle length not as punishments, but as guides. They show you exactly where friction exists in your go-to-market motion. The roadmap—built on process refinement, smart automation, clear ownership, and transparent data—is your blueprint for eliminating that friction for good.
This systematic approach transforms your pipeline from an unpredictable black box into a clear, manageable asset. When you know your numbers and trust your process, forecasting becomes a science, not a guess. According to a study from the Sales Management Association, companies with a formal, defined sales process experience 18% more revenue growth than those without one.
The ultimate goal is to create a system where the "right way" to sell is also the easiest way. When your CRM workflows, data standards, and SLAs are perfectly aligned, your team can focus entirely on selling, confident that the underlying process is supporting them.
Your Path to Predictable Revenue
By embracing a data-first mindset, you shift your entire organization’s focus from short-term wins to long-term health. The principles of effective pipeline management are foundational to building a resilient business that can scale without breaking.
Ready to stop guessing and start building a data-backed plan for growth? Our diagnostic approach is designed to give you the clarity you need to scale predictably.
Learn how the 6-Week Revenue Growth Sprint applies this framework to uncover and fix the hidden revenue leaks in your business.
Common Questions from Founders & RevOps Leaders
We get asked these questions all the time by founders and revenue leaders navigating the scale-up journey. Here are some quick, practical answers to the most common challenges we see.
What’s a Realistic Pipeline Coverage Ratio for a €10M ARR SaaS?
For a SaaS business at your stage, you should be aiming for a pipeline coverage of 3x to 4x your quarterly revenue target. Think of it as your safety net. This buffer ensures you have enough qualified deals in play to absorb the inevitable last-minute slips and still nail your number.
Anything below 3x is a red flag. It usually means you have a pipeline generation problem or your team is forecasting with rose-tinted glasses. When your coverage is that thin, losing just one or two deals can completely derail your quarter.
How Can We Fix Our CRM Data Hygiene Without Making Sales Reps Hate Us?
This is a classic battle, but you win it with smart automation, not more rules. Forcing reps to fill out a dozen fields after every call is a surefire way to get bad data and frustrated sellers. The goal is to make doing it right easier than doing it wrong.
First, be ruthless about what's required. Only mandate fields for the absolute most critical deal stages. Next, automate everything you can—sync data from calendars, sales engagement tools, and enrichment platforms. Finally, give reps a simple dashboard showing their own data quality score. It gamifies the process and makes hygiene a visible, manageable part of their workflow instead of a chore.
What's the One Quick Win That Delivers the Biggest Punch?
If you're looking for the fastest, most impactful fix, it's almost always implementing automated, rules-based lead routing with a strict Service Level Agreement (SLA). This isn't a minor tweak; it's a game-changer.
Here's the 3-question framework to identify this bottleneck:
- •What is our current average lead response time? (If you don't know, that's the first problem).
- •How are leads assigned right now? (If the answer is "manually" or "once a day," you've found the leak).
- •What percentage of MQLs never receive a first touch? (Anything over 5% is a major red flag).
Setting up a system that instantly assigns new leads to the right rep with a clear follow-up clock (say, under 2 hours) immediately plugs one of the most common and costly leaks in any sales pipeline.
Ready to stop guessing and start building a data-backed plan to scale your revenue? At Altior & Co., we build predictable growth engines for B2B SaaS and fintech companies.
Learn how the 6-Week Revenue Growth Sprint applies this framework to find and fix the hidden leaks costing you revenue.