Tired of a leaky funnel? This guide reveals the RevOps-driven growth strategy B2B SaaS leaders use to build a predictable revenue engine and scale effectively.
A growth strategy for a B2B SaaS company is more than a slide deck with ambitious targets. It’s the on-the-ground playbook that dictates how you win market share, grow revenue, and build a loyal customer base. For your scale-up, this means graduating from high-level ideas to a measurable, repeatable system for finding, winning, and keeping customers.
But here’s the thing: the best strategies aren't just plans. They're engines, meticulously built on data and process, and every sentence in this guide will show you how to build one.
Why Your Current Growth Strategy Is Leaking Revenue
If you’re a B2B SaaS or fintech leader steering a company in the €8–€10M ARR range, your growth strategy should be a well-oiled machine. You've found product-market fit. You’ve built a team. And yet, you’re probably still fighting a sluggish pipeline, unpredictable forecasts, and a nagging gap between the effort you're putting in and the results you're getting.
This isn't a strategy problem—it's an operational one. Your growth engine isn't sputtering because of a flawed design; it's sputtering because of hidden leaks in the plumbing.

Stacks of coins on a table with blurred people working, overlayed with 'REVENUE LEAKS' text, symbolizing financial losses.
The Dangerous Gap Between Perception and Reality
The single biggest threat to your growth strategy is the gap between what you think is happening and what the data actually shows. Revenue doesn't just vanish; it disappears into this gap. For instance, a well-known HubSpot report highlights that while everyone chases new logos, failing to keep the customers you already have quietly bleeds your resources dry.
You might believe your sales team is lightning-fast on follow-ups, but the data inside Salesforce consistently shows average lead response times are far slower than anyone admits—costing you the hottest, highest-intent deals.
As RevOps leader Hung Lee puts it, "Without data, you're just another person with an opinion." A leaky funnel doesn't just lose you a deal today; it actively damages your brand's reputation and poisons future growth.
This forces a crucial shift in focus. The most important question isn't, "What's our next growth hack?" It’s, "What is really happening inside our funnel, right now?"
Leadership Perception vs Operational Reality in Your Funnel
The table below pinpoints the common blind spots we uncover when auditing a company's revenue engine. It shows the dangerous chasm between the assumptions you might be running on and the operational truth—the very leaks that sabotage an otherwise solid growth strategy.
| Common Leadership Perception | Data-Driven Reality | Impact on Growth Strategy |
|---|---|---|
| "Our sales team follows up on hot leads within a day." | "Sales leaders report 80% follow-up compliance, but CRM data shows the actual rate is closer to 25%." | Marketing spend is wasted and high-intent prospects are handed directly to competitors. |
| "We trust our CRM data for forecasting." | "Only 55% of sales activities are logged, making attribution a guess and forecasts unreliable." | You can't replicate what works or accurately predict where the business is heading. |
| "Our sales cycle length is consistent and predictable." | "The sales cycle varies by over 50% depending on the lead source—a detail we aren't tracking." | Resources are allocated inefficiently and pipeline coverage models are pure fiction. |
| "Marketing and Sales are aligned on what a good lead is." | "Sales only converts 5% of MQLs, signaling a major disconnect on lead quality definitions." | Constant friction between teams burns morale and creates a profoundly leaky funnel. |
Recognizing these disconnects is the first, most critical step. Once you stop guessing and commit to a data-first approach, you can finally plug the leaks and start building the scalable, predictable revenue machine your business needs to thrive.
The Four Pillars of a Modern B2B Growth Engine
A scalable growth strategy isn’t just a slick marketing campaign. It’s an engine—an integrated system built on four interconnected pillars. If one of these pillars is weak, the whole structure gets wobbly, leading to the exact kind of revenue leaks we’ve been talking about.
Think of it like building a high-performance race car. You wouldn't obsess over the engine but ignore the chassis or suspension. To win, every component must work in perfect harmony.
Pillar 1: Market Strategy
This is your foundation. Your Market Strategy defines exactly who you serve and the specific problem you solve for them. It’s about getting past vague personas and achieving a surgical understanding of your Ideal Customer Profile (ICP).
This pillar forces you to answer the tough questions:
- •Who is our most profitable customer segment? Not just who buys from you, but who stays, expands, and becomes a raving fan.
- •What is the specific, high-value pain point we solve better than anyone else? Getting this crystal clear fuels all your messaging.
- •What market trends are creating opportunities or threats? Understanding the landscape prevents you from getting blindsided.
A flimsy market strategy leads directly to watered-down marketing and a sales team wasting time on prospects who were never going to buy.
Pillar 2: Product Strategy
Your product is the heart of your value proposition. A strong Product Strategy ensures your roadmap is linked to customer retention and expansion revenue, not just chasing random feature requests. It's about building a product that solves your ICP's core problem so effectively they can't imagine their workday without it.
Key considerations here are:
- •Roadmap Alignment: Is your development team focused on features that drive higher retention and create natural upsell opportunities?
- •User Feedback Loops: How are you systematically capturing and prioritizing customer feedback to inform product decisions?
- •Competitive Differentiation: What unique value does your product deliver that protects you from being a commodity?
A sharp product strategy helps you capitalize on market shifts. According to a Gartner forecast, worldwide IT spending is projected to grow 8% in 2024. For a SaaS company, this signals a clear opportunity to align product features with expanding enterprise tech budgets.
Pillar 3: Go-to-Market (GTM) Strategy
This is the orchestration pillar. Your GTM Strategy dictates how you attract, engage, and convert your ICP. It’s the bridge connecting your product's value to the market's pain points through coordinated marketing, sales, and customer success motions.
To build a robust B2B growth engine, you have to consider incorporating top marketing automation strategies that streamline operations and let you scale effectively. A well-defined GTM ensures your teams are running coordinated "plays" designed to move prospects through the funnel with purpose.
Pillar 4: Revenue Operations (RevOps)
If the first three pillars are the car's components, RevOps is the central computer connecting everything. It provides the data, processes, and systems that make your entire growth strategy measurable, repeatable, and scalable.
Without a strong RevOps function, your Market, Product, and GTM strategies are just a collection of well-intentioned but disconnected ideas. RevOps provides the operational backbone that turns theory into a predictable revenue machine.
This fourth pillar is what separates high-growth companies from everyone else. It ensures that lead handoffs are seamless, the data in your CRM is trustworthy, and every decision is backed by objective truth, not gut feelings. You can learn more about building this critical function in our comprehensive guide to Revenue Operations. It’s the key to transforming your growth plan from a document into a dynamic, results-driven engine.
Introducing the RevOps Growth Blueprint
A growth strategy on paper is worthless. Where most plans die is the gap between a great idea and disciplined execution. That’s why we built the RevOps Growth Blueprint—a systematic, diagnostic framework designed to build a revenue machine that delivers predictable results, not just wishful thinking.
This isn’t about guesswork. It’s a structured process for engineering revenue growth. The blueprint unfolds in three logical phases designed to find the truth, focus your effort, and deliver a measurable impact.
Think of it this way: your business rests on a few core pillars. RevOps is the central hub that connects and optimizes everything, ensuring the entire structure is sound.
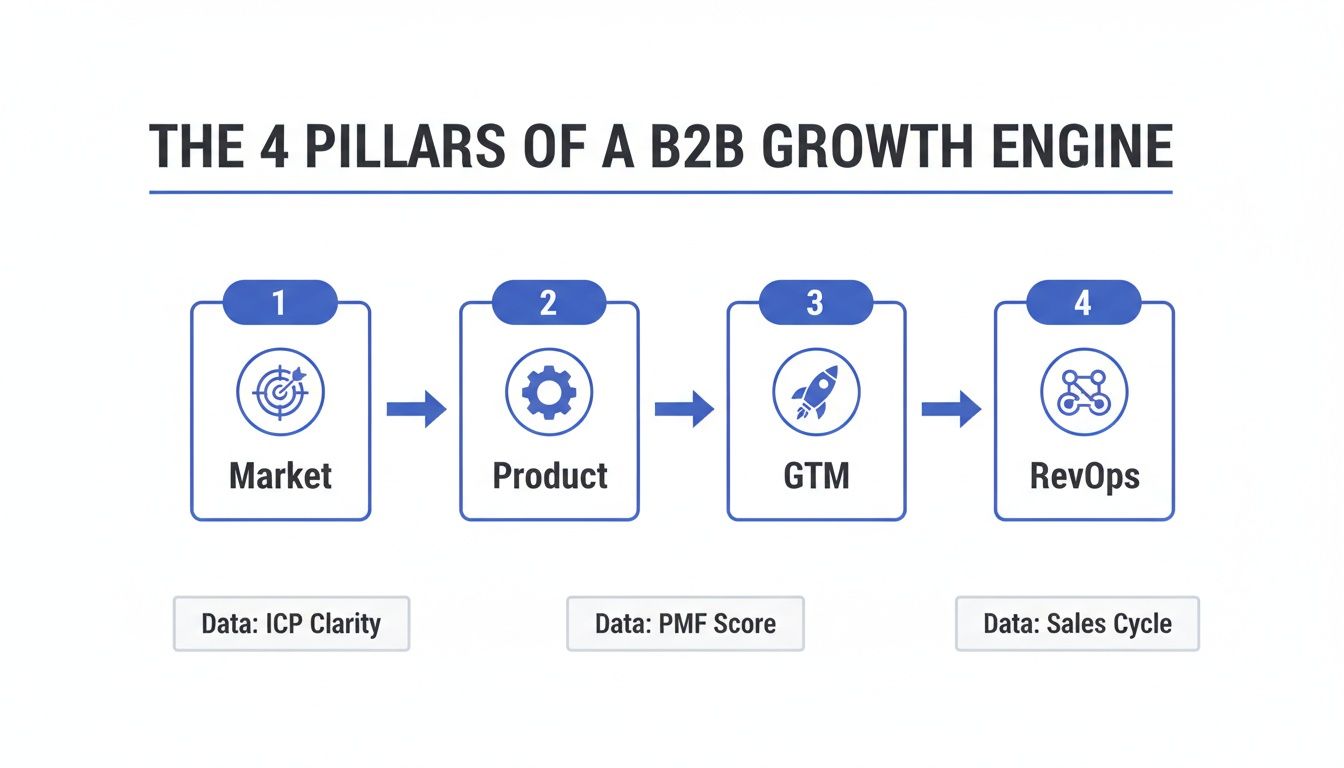
A diagram outlining the 4 pillars of a B2B growth engine: Market, Product, GTM, and RevOps, with associated data metrics.
This visual shows how a solid foundation in your market and product feeds your GTM execution. But it’s the RevOps core that enables, measures, and strengthens the whole system.
Phase 1: Diagnosis and Baseline
First, we conduct a forensic audit of your revenue engine. Before you can fix anything, you must establish an objective baseline—the ground truth. This means digging into the raw data from your CRM and marketing platforms to answer the fundamental questions that most leadership teams can only guess at.
We're not looking for opinions; we're hunting for numbers. This diagnostic phase focuses on quantifying the core metrics of your entire funnel:
- •Lead Response Time: What is the actual average time it takes for a sales rep to contact a new MQL?
- •Conversion Rates: What percentage of leads become opportunities? And what percentage of those opportunities actually close?
- •Sales Cycle Length: How many days does it really take to close a deal, broken down by lead source and deal size?
- •Pipeline Coverage: Do you have enough qualified pipeline to hit your next quarter’s target, based on historical close rates?
According to ChartMogul, the top quartile of SaaS companies maintain a net revenue retention rate over 119%. That’s impossible without first understanding the baseline customer journey, which is exactly what this diagnostic uncovers. This step replaces assumptions with cold, hard facts.
Phase 2: Prioritization and Quick Wins
Once the diagnosis reveals the specific leaks in your funnel, the next phase is ruthless prioritization. Not all problems are created equal. A 48-hour lead response time might be costing you more in lost ARR than a slightly disorganized CRM. The goal here is to map every identified issue to a specific action, an owner, and its estimated dollar impact.
This is where we separate ‘quick wins’ from ‘scalable plays.’
A ‘quick win’ is a high-impact, low-effort fix that can be deployed immediately—like implementing automated lead routing to enforce a 2-hour SLA. A ‘scalable play’ is a more foundational project, like a full data hygiene overhaul, that requires more resources but delivers long-term stability.
By quantifying the financial cost of each leak, you build a business case for change. This turns a long, overwhelming list of "things to fix" into a clear, prioritized roadmap where the most expensive problems get solved first.
Phase 3: Implementation and Measurement
The final phase is all about execution. Armed with a prioritized roadmap, we deploy fixes in focused, time-bound sprints. Each sprint is designed to tackle a specific revenue leak with a clear owner, a defined timeline, and—most critically—a pre-agreed success metric.
For example, if the diagnosis found that only 60% of MQLs were being followed up on, an implementation sprint might involve deploying a simple AI-powered automation to ensure 100% follow-up, reflecting our belief that AI should amplify truth, not noise.
Success isn't subjective; it’s measured by tangible improvements in your core KPIs. We define clear measurement criteria from the start: “Success = a 15% improvement in lead-to-opportunity conversion rate within six weeks.” This approach transforms your growth strategy from a static document into a dynamic, results-driven system. To see how this translates into tangible outcomes, explore our insights on achieving sustainable revenue growth.
How SaaS and Fintech Leaders Fix Their Growth Engines
Strategy is just a theory until it’s battle-tested. High-level plans are great for the boardroom, but a growth strategy proves its worth when it solves the expensive, tangible problems happening on the ground. For you, this means getting out of the whiteboard sessions and into the operational trenches where revenue is actually won or lost.
The smartest leaders I’ve worked with don't just chase the next shiny object; they obsessively fix what's broken. They use a RevOps mindset to diagnose their entire revenue system, pinpoint the leaks, and roll out precise fixes you can actually measure.
Case Study: The €250k Lead Response Leak
Let me tell you about 'Fintech X,' a promising scale-up that had hit a classic growth plateau. Their leadership team was convinced their sales reps were on top of every lead. But a quick diagnostic audit uncovered a shocking reality: their average lead response time was over 72 hours.
This one operational failure was costing them an estimated €250k in lost ARR every single quarter.
High-intent leads—people ready to buy—were going cold. The problem wasn’t lazy reps; it was a broken system. The fix was a simple, yet powerful, operational play:
- •Action: We implemented automated lead routing with a strict 2-hour SLA.
- •System: We configured their CRM to instantly assign new leads to the next available rep using a round-robin system.
- •Measurement: We tracked lead-to-opportunity conversion rates on a weekly basis.
The result was a dramatic turnaround. In just six weeks, 'Fintech X' boosted its lead-to-opportunity conversion rate from 8% to 26%. This wasn't a flashy new marketing campaign; it was simply fixing the plumbing.
This shows that the most powerful growth strategy is often the one that stops you from wasting the opportunities you already have. For anyone looking to tighten up their own funnel, this practical guide to website conversion rate optimization offers great tactics for diagnosing and converting more visitors.
Case Study: The Myth of the "Qualified" MQL
Another classic blind spot is the disconnect between Sales and Marketing. Take ‘SaaS Y,’ a company with a marketing engine generating over 1,000 Marketing Qualified Leads (MQLs) a month. On paper, their funnel looked fantastic. But the sales team was burning out, leading to friction and finger-pointing.
A deep dive into their unified CRM and marketing automation data revealed the real issue. Only 40% of their so-called MQLs actually met the criteria that Sales and Marketing had supposedly agreed on. The marketing team was hitting a volume target, while sales paid the price in wasted hours.
The solution was a data-driven realignment:
- •Action: We completely redefined the MQL, using stricter, data-backed criteria.
- •System: We updated the lead scoring models in their automation platform to automatically filter out the noise.
- •Measurement: We shifted focus to the MQL-to-SQL conversion rate as the one metric that truly mattered.
By prioritizing quality over quantity, 'SaaS Y' saw a 22% lift in close rates within a single quarter. This operational shift turned their growth engine from a noisy, inefficient machine into a finely-tuned system that delivered high-quality pipeline, month after month. This kind of operational efficiency is critical, as a Forrester report notes that companies with aligned GTM teams achieve up to 19% faster revenue growth.
Measuring the True Success of Your Growth Strategy
"If you can't measure it, you can't manage it." It's an old cliché for a reason—it’s the absolute truth for any modern growth strategy. A successful plan isn't a compelling slide deck; it's defined by clear, quantifiable improvements in the key performance indicators (KPIs) that actually drive your business forward.
For your scale-up, hope is not a strategy. Data is.
This is where so many leaders go wrong. They chase vague goals like "improving conversion." A real growth strategy is far more precise. Success isn’t just improving conversion; it’s ‘increasing trial-to-paid conversion from 12% to 18% within 90 days.’ That specificity transforms your strategy from an abstract idea into a measurable, accountable project.
The Core Four Growth Metrics
While every SaaS business is unique, four core metrics form the bedrock of a healthy revenue engine. These are the numbers that tell the true story of your operational health and directly connect your day-to-day actions to financial outcomes.
- •Pipeline Velocity: The ultimate health metric for your sales funnel. It calculates how much qualified pipeline you generate per day, telling you how quickly deals move from creation to close.
- •Sales Cycle Length: How long does it actually take to close a deal? Shortening the sales cycle from 90 to 60 days has a massive impact on cash flow and growth capacity.
- •Lead-to-Opportunity Conversion Rate: This reveals the quality of your pipeline and the effectiveness of your early-stage sales process. A low conversion rate often points to a disconnect between marketing and sales.
- •Customer Acquisition Cost (CAC): How much does it cost you to acquire a new customer? A successful growth strategy should not only increase revenue but also improve efficiency, driving CAC down over time.
Connecting Operations to Financial Outcomes
The real power of a systems-first approach is its ability to draw a straight line from a small operational fix to a significant financial result. For example, fixing a slow lead response time isn't just an efficiency tweak; it's a direct lever for revenue growth.
A study by SaaStr found that if you follow up with a lead within 5 minutes, you are 9x more likely to convert them. Waiting even 30 minutes can cause your conversion rates to plummet. This is the ROI of operational excellence.
When you implement an automated lead routing system with a 2-hour SLA, you're not just making sales reps' lives easier. You are directly influencing your lead-to-opportunity conversion rate, which in turn shortens your sales cycle and increases pipeline velocity. Every operational improvement must be tied to a financial outcome.
For a deeper dive into which metrics to prioritize, check out our guide on essential KPI tracking for SaaS companies.
This is how you prove the value of a robust growth strategy. You show stakeholders that a small investment in process and systems can yield a 15–25% improvement in pipeline velocity within a single quarter. You replace guesswork with a clear, measurable framework that connects every action to a number on the bottom line.
Your First 6-Week Revenue Growth Sprint
Frameworks and theory are great, but a growth strategy is useless until you put it to work. This is your playbook for turning those insights into immediate, tangible results. We've honed a practical, 6-week sprint that takes you from diagnosis to measurable improvement, creating the momentum you need for long-term, scalable growth.
This sprint is designed to deliver real outcomes, fast. Its whole purpose is to replace ambiguity with a clear, data-driven plan.

Office setup for a 6-week sprint with a calendar, stopwatch, and laptop on a wooden table.
Weeks 1–2: Diagnosis and Baseline
The first two weeks are all about establishing the ground truth. We connect directly to your core systems—whether it's Salesforce or HubSpot—to pull the raw, unfiltered data on how your revenue engine is really performing. This isn't about opinions; it's about building a baseline from cold, hard facts.
We zero in on the metrics that actually matter:
- •True Lead Response Time: What’s the real delay between a lead hitting your system and the first sales touch?
- •Funnel Conversion Rates: What percentage of MQLs ever become SQLs? And what percentage of those opportunities actually close?
- •Sales Cycle Length: How many days does it really take to close a deal, broken down by source and deal size?
This diagnostic phase is the bedrock of accurate forecasting. You can dive deeper into this in our guide to building a reliable revenue forecasting model.
Weeks 3–4: Prioritization and Quick Wins
Once we have a clear baseline, we shift into analysis and prioritization. We use the data to pinpoint your top three to five revenue leaks—the operational gaps causing the most significant financial damage. The goal here is to separate the high-impact, low-effort fixes from the bigger, more complex projects.
"Sales leaders often report 80% follow-up compliance, but CRM data frequently reveals the actual rate is closer to 25%." – Common RevOps Diagnostic Finding
During these weeks, we roll out immediate "quick wins." These are simple but powerful fixes, like optimizing lead routing rules to enforce a strict SLA or automating follow-up tasks for leads that have gone dark. These initial moves are all about plugging the most obvious leaks and generating positive momentum right away.
Weeks 5–6: Scalable Plays and Blueprint Delivery
In the final stretch, we start tackling the larger, more foundational issues we uncovered during the diagnosis. This could be anything from data hygiene projects to a complete CRM workflow redesign. These are the scalable plays that ensure your growth is actually sustainable.
By the end of week six, we deliver your complete Revenue Growth Blueprint. This isn't just another report. It's a prioritized roadmap with clear owners, service-level agreements (SLAs), and the expected financial impact for the next 6–12 months. The whole point is a measurable business outcome: expect a 15–25% improvement in pipeline velocity in just six weeks.
Answering Your Toughest Growth Strategy Questions
We've covered the frameworks, metrics, and what a modern growth strategy looks like. But I know what happens when theory meets reality. Let's tackle the questions that come up when B2B SaaS and fintech leaders like you get serious about building a revenue engine that actually scales.
What's the Very First Step to Fixing Our Growth Strategy?
The first step is always diagnosis. Before you touch a single workflow, you have to get an honest, data-backed look at what’s really happening inside your revenue engine. Forget the assumptions and the stories you hear in meetings.
This means you need real numbers for fundamental questions:
- •What is our actual, no-fluff lead-to-close conversion rate?
- •What's the average sales cycle, broken down by our ideal customer profiles?
- •How long does it really take for a new lead to get that first touch from sales?
Without these figures, any change you make is a shot in the dark. A proper diagnostic, like the kind Forrester champions for improving GTM effectiveness, gives you the ground truth you need to make smart decisions and put your energy where it will make the biggest difference.
How Is a RevOps-Driven Strategy Different?
A traditional growth plan is almost always built in silos. Marketing has their MQL number, sales has their quota, and customer success is trying to keep the renewal rate up. The problem is, there’s no operational glue holding it all together.
A RevOps-driven strategy is a completely different beast. It forces your entire revenue funnel to work as a single, cohesive unit.
It uses a shared data foundation to get marketing, sales, and customer success all pointed at the same target: efficient, predictable growth. You stop optimizing for individual team metrics and start optimizing for the health of the entire system.
This approach is all about the mechanics—the handoffs, the data flows, the automations—that make the whole customer journey feel like one seamless machine, not a series of clunky, disconnected steps.
Realistically, How Quickly Can We Expect to See Results?
With a focused, sprint-based approach, you can see a real impact surprisingly fast. The trick is to split the work into immediate fixes and longer-term projects.
- •Quick Wins (4–6 Weeks): You can tackle operational snags like broken lead routing or automating follow-up sequences and see a measurable lift in pipeline metrics—like lead response time and conversion rates—in about a month.
- •Scalable Plays (1 Quarter+): The bigger, foundational changes—like cleaning up your CRM data or redesigning sales territories based on a new ICP—usually take a full quarter to really move the needle on financial metrics like CAC and LTV.
The whole idea is to prioritize fixes by the classic effort vs. impact matrix. When you lock in those early wins, you build momentum and get the buy-in you need from the rest of the organization to go after the bigger, more complex challenges that create truly scalable growth.
Ready to apply this thinking to your own business? The Altior & Co. 6-Week Revenue Growth Sprint is designed to deliver a complete, data-backed blueprint for your growth, helping you find and fix your most expensive revenue leaks.
Learn how the 6-Week Revenue Growth Sprint applies this framework to your business at https://altiorco.com.