Discover why revenue growth stalls in B2B SaaS. This guide uncovers the 5 hidden operational leaks in your funnel and provides a clear framework to fix them.
Is your revenue flatlining? Your team is working harder than ever, lead volume seems decent, but the revenue needle just won't budge. For B2B SaaS and fintech companies that sailed smoothly to the €8–10M ARR mark, hitting this wall feels sudden and deeply frustrating. But the growth didn't just stop. It's seeping away through a thousand tiny operational cracks you can't see on your dashboard.
The real culprits are almost always hiding in plain sight: slow lead handoffs, a messy CRM, and the ever-widening gap between what your team thinks is happening and what the data proves is actually happening.
Why Your Growth Engine Is Sputtering (And It’s Not Your Team’s Fault)
Hitting a growth ceiling isn't a sign of a failed strategy; it's a predictable outcome of outgrowing your systems. Think of your go-to-market function as a high-performance engine. In the early days, it runs clean and tight. But as you add more horsepower—more leads, more reps, more customers—small fittings start to loosen. A slow data sync here. An inconsistent follow-up process there.
Individually, they seem like minor annoyances. Collectively, they cause the engine to lose pressure, and your once-reliable growth sputters to a halt.
This isn't about telling your team to work harder. It’s about giving them a system that makes it easy to work smarter. The core problem is a fundamental misalignment between your growth goals and the operational systems built to execute them. As Jason Lemkin, founder of SaStr, often points out, "Second-order revenue problems are almost always process and systems problems."
Your sales leaders might swear by their follow-up discipline, but a quick CRM audit often reveals a brutal truth: sales leaders report 80% follow-up compliance, but data shows only 25% of marketing-qualified leads are getting touched within the first critical hour. This gap between perception and reality is where your revenue disappears.
Diving into a structured framework like Revenue Growth Management (RGM) can give you the right lens to diagnose these systemic issues before they bring your engine to a complete stop.

A model engine with a brass pipe dripping water onto a golden disk, symbolizing revenue leaks.
The 5 Hidden Leaks Draining Your Revenue
After auditing dozens of growth-stage companies, we’ve found that most stalled growth can be traced back to five core operational leaks. These issues are rarely visible on a high-level dashboard but have a massive, cumulative impact on your ability to generate predictable revenue. They represent the gap between perception and reality.
Here’s a quick diagnostic overview of the most common culprits we find lurking in the operational shadows.
The 5 Hidden Reasons Your Revenue Growth Stalls
| Symptom of Stalled Growth | Underlying Operational Leak | Key Diagnostic Metric |
|---|---|---|
| "Our lead volume is up, but revenue isn't." | Inefficient Lead Management | Lead Response Time: The average time from MQL creation to the first sales touchpoint. |
| "Deals are taking forever to close." | A Bloated Sales Cycle | Sales Velocity: The speed at which deals move through your pipeline, measured in days. |
| "We're always scrambling to hit our number." | Gaps in Pipeline Coverage | Pipeline Coverage Ratio: The value of your qualified pipeline divided by your revenue target. |
| "I can't trust our pipeline reports." | Poor CRM Data Hygiene | Data Integrity Score: The percentage of key fields (e.g., deal stage, close date) that are accurately filled. |
| "Marketing and Sales are pointing fingers." | Misaligned GTM Teams | MQL-to-SQL Conversion Rate: The percentage of marketing-qualified leads that sales accepts and converts. |
These leaks aren't just minor inconveniences; they're the silent killers of momentum.
Fixing them requires a deliberate shift from gut-feel management to a data-first diagnostic approach. To build that foundation, you need a solid understanding of how to implement effective KPI tracking. In the sections that follow, we'll break down each of these five leaks, showing you exactly how to find them, measure their impact, and plug them for good.
Diagnosing Inefficient Lead Management

A desk with a pocket watch, documents, laptop, and a Lead Response logo, symbolizing efficient business operations.
Here's one of the most common and damaging reasons revenue growth grinds to a halt: your lead handoff process is broken. The moment a prospect requests a demo or downloads a high-intent guide, an invisible clock starts ticking. Research from Gartner confirms that every single hour that passes before a salesperson makes a meaningful connection drastically slashes your odds of ever winning that deal.
This isn't just a minor leak in the funnel; it's a gaping hole in your revenue engine. You’ve invested serious time and money to generate that Marketing Qualified Lead (MQL), but without a lightning-fast handoff, that investment simply vanishes.
The Perception Gap in Lead Response Time
Ask most sales leaders about their team's responsiveness, and you'll hear things like, "Oh, we get back to every lead within a day." But the timestamp fields in your CRM almost always tell a different—and far more painful—story.
This chasm between perception and reality is precisely where growth stalls. A HubSpot study revealed that while 75% of companies claimed their lead response time was under an hour, a deep dive into their actual data showed only 25% hit that mark. That massive 50% gap represents a graveyard of missed opportunities, wasted marketing spend, and frustrated reps chasing ghosts.
The Reality Check: An MQL that isn't contacted within the first hour is practically worthless. A 24-hour delay doesn't just lower your conversion rate—it often destroys it. The prospect has already moved on, started talking to your competitors, or completely lost the spark of interest that brought them to you in the first place.
The 3-Step Lead Lifecycle Audit
Fixing this requires moving from assumptions to absolutes. The solution isn't just yelling at your team to "be faster." It’s about building an operational system that makes speed the default. This is where a diagnostic sprint truly begins.
Here’s a simple framework to audit your current process and uncover the truth:
- •Measure Your True Lead Response Time: Pull a report of all MQLs created in the last 90 days. Compare the MQL creation timestamp with the timestamp of the first sales activity—a call, an email, or a booked meeting. Calculate the average time in hours. Don't be surprised if it's much higher than you thought. Goal: Under 15 minutes.
- •Calculate MQL-to-SQL Conversion Rate: What percentage of leads from marketing are actually accepted by sales and turned into a Sales Qualified Lead (SQL) or an active opportunity? A low conversion rate is a massive red flag, often pointing to poor lead quality or, more commonly, a slow follow-up process. To dial this in, you'll need a solid system for lead scoring. Goal: 25% or higher for inbound leads.
- •Map Your Lead Routing Logic: How do leads get to a rep? Is it based on clear, automated rules like territory or company size? Or is it a chaotic "round-robin" that nobody trusts? Manual routing is a guaranteed bottleneck. Every minute a lead sits unassigned is a minute it's getting colder.
By measuring these three areas, you establish a clear, data-driven baseline. This isn't about blame; it's about finding and fixing the systemic flaws. A proper RevOps framework replaces manual guesswork with automated routing, strict Service Level Agreements (SLAs), and reporting that shows exactly where the delays are. Looking into solutions like AI-powered lead generation can also bring new efficiencies to the top of your funnel by using AI to amplify truth, not noise.
Ultimately, a successful RevOps sprint installs a system where a high-value lead lands in a salesperson’s hands within minutes—not hours or days.
Identifying When Rising Costs Outpace Revenue
Real growth isn't just about watching your top-line revenue tick up; it's about building a profitable, scalable machine. One of the most common reasons growth stalls is when your internal costs—especially your Selling, General, & Administrative (SG&A) expenses—start to climb faster than your revenue. It’s a subtle but powerful anchor dragging on your momentum.
This isn’t about a few bad investments. It's the slow, creeping death of administrative bloat and inefficient internal processes. This creates a "hidden factory" inside your operations, where every minute your expensive sales reps spend fighting with a messy CRM, manually building reports, or chasing down internal approvals is a minute they aren't actually selling.
The Slow Burn of Operational Inefficiency
As you scale, complexity is inevitable. More people, more processes, and more data create friction where there was none before. What used to be a quick chat between sales and marketing now becomes a multi-step, broken workflow. This operational drag quietly eats up resources, making your entire go-to-market motion far more expensive than it needs to be.
You can even see this trend at a macro level. A recent PwC study highlighted that many growing companies saw profitability gains completely erased by rising SG&A costs, which climbed to 8.1% of revenue. When operational costs inflate like this, they directly suffocate your ability to invest in actual growth. For a SaaS company, this means you're paying high salaries for skilled sellers who are then forced to spend their days on low-value, non-selling tasks.
As Verne Harnish, author of Scaling Up, often says, a lack of alignment at the senior level flows downhill into every single part of the business. This misalignment is a primary driver of rising SG&A, as teams start working at cross-purposes, duplicating effort and wasting precious resources.
This isn't just a cost problem; it's a growth killer. The money tied up in inefficiency is capital that could be used to hire another account executive, double down on a marketing channel, or invest in product development.
How to Diagnose Your Hidden Factory Costs
You can't fix what you can't see. The first step is to stop guessing and start quantifying the real cost of this "hidden factory" by auditing where your go-to-market team's time is actually going.
Start by measuring these key indicators of operational drag:
- •Sales Time-on-Task Analysis: What percentage of a salesperson’s day is spent on core selling activities like prospecting, demos, and negotiating? How much is spent on admin tasks like data entry, internal meetings, and report building? Best-in-class teams see reps spending over 50% of their time selling. Most stalled companies we audit are stuck closer to 25–30%.
- •Cost Per Opportunity: This is a simple but powerful metric. Calculate the total cost of your sales and marketing efforts (salaries, tools, ad spend) and divide it by the number of qualified opportunities you generated in a quarter. A rising cost per opportunity is a flashing red light that your efficiency is dropping.
- •Tech Stack Utilization: How many of your expensive software tools are actually being used to their full potential? Underutilized platforms are a classic symptom of admin bloat, where tools are bought to solve process problems without ever fixing the broken workflows underneath.
Once you have this data, the path forward becomes much clearer. A focused RevOps framework tackles these hidden costs head-on. By automating manual tasks like reporting and lead routing, cleaning up CRM data so reps finally trust it, and streamlining workflows between teams, you can reclaim that lost, productive selling time.
The goal here is simple: ensure every dollar you invest in your go-to-market engine generates a measurable and profitable return. That’s how you turn a cost center into a true growth driver.
Uncovering Gaps in Your Pipeline Coverage
Your revenue forecast is only as solid as the pipeline it’s built on. Time and time again, when growth stalls, the culprit is a fundamental mismatch between the target and the actual pipeline needed to hit it. It boils down to one simple question: do you have enough qualified opportunities in the works to make your number next quarter?
Most leaders think they do. But that confidence is often propped up by messy CRM data and a heavy dose of wishful thinking. The gap between a sales rep’s optimistic forecast and the cold, hard data is precisely where revenue targets get missed, quarter after quarter.
Moving Beyond the Basic 3x Formula
You’ve heard the old rule of thumb: maintain 3x your quota in qualified pipeline. If the quarterly target is €1 million, you need €3 million in active deals. But let's be honest—this simple metric is notoriously unreliable on its own. It treats every deal the same, and we all know they aren't.
A healthy pipeline isn't just about the total value; it’s about balance and quality. Insights from SaaS authorities like SaaStr show that high-growth companies often push for 4x or even 5x coverage, especially when they're breaking into new markets or navigating longer sales cycles. Sticking to a blanket 3x ratio can leave you dangerously exposed.
The real problem pops up when a single massive, low-probability deal makes your overall pipeline coverage look healthy. When that "whale" of a deal inevitably pushes to the next quarter, your team is left scrambling because the rest of the pipeline was never strong enough to cover the target on its own.
This is a classic symptom of stalled growth—relying on a vanity metric that masks deep, underlying weakness.
The 3-Step Pipeline Health Audit
To get a real picture, you have to stop looking at your pipeline as one giant number. You need to start segmenting it to uncover the gaps hiding in plain sight. This turns your coverage ratio from a simple metric into a powerful strategic tool.
Here’s a practical framework to audit your real pipeline coverage:
- •Segment by Sales Rep: Is the pipeline evenly distributed, or is one superstar holding up the entire team's number? This is a massive risk. If that one rep has a bad month, the whole company misses its forecast.
- •Segment by Stage: Where is the value concentrated? If 80% of your pipeline value is stuck in early stages like "Discovery," it's not a reliable indicator for next quarter's revenue. You need a healthy spread across every stage of your sales process.
- •Segment by Product Line or Region: Do you have enough pipeline to actually hit your growth targets for that new product or territory? Segmenting shows whether your strategic initiatives are backed by real sales opportunities or just hope.
This level of analysis brings the clarity your teams desperately need. If you want to dig deeper into this, check out our guide on how to properly calculate and manage your pipeline coverage.
Once you diagnose these gaps, the fix becomes obvious. Low coverage means marketing and sales development need to get on the same page and generate more qualified leads. High coverage but low win rates? That points to a problem with sales effectiveness or deal qualification. By forcing your pipeline data to be honest, you empower your teams to solve the right problems and finally get your growth engine firing again.
Taming an Expanding Sales Cycle
When you start chasing bigger, more complex deals upmarket, a longer sales cycle is just part of the game. That’s natural. But an uncontrolled, perpetually expanding sales cycle? That's one of the most reliable signals that your revenue growth is about to hit a brick wall.
When deals take longer to close, you’re not just delaying revenue. You’re stretching your sales team thin, destroying your forecast accuracy, and giving competitors a golden opportunity to swoop in and steal the deal. This isn't a problem that just fixes itself; it's a symptom of hidden friction in your process. Deals get bogged down by fuzzy next steps, a lack of alignment with the buyer, or internal bottlenecks that no one has even tried to measure. The longer a deal lingers, the more its momentum dies, and the less likely it is to ever see the finish line.
Pinpointing Your Pipeline Bottlenecks
You can't shorten a sales cycle you don't actually measure. Step one is to stop relying on gut feelings about how long deals should take and start digging into the data to see how long they actually take. The goal is to calculate your average sales cycle length from the moment a lead becomes a qualified opportunity to the day it's marked "Closed-Won."
But a simple average won't cut it. A single number like "90 days" hides the real story. The true diagnostic power comes from breaking it down and analyzing the time spent in each individual deal stage.
According to data from Salesforce, the average B2B sales cycle can vary dramatically by industry, but a consistent increase of 15–20% year-over-year in your own cycle is a clear warning sign. The most common bottlenecks occur not during initial discovery, but in the mid-to-late stages where momentum is supposed to accelerate.
This analysis is like an MRI for your sales process—it immediately shows you where deals are getting stuck. Is there a massive delay between the demo and getting a proposal out the door? Does everything grind to a halt during legal review and contract negotiation? Each stage tells you a different story about where the friction lies.
A 3-Tactic Framework to Compress Your Sales Cycle
Once you’ve found the logjams, you can apply targeted fixes instead of just yelling at your team to "close faster." This is a classic RevOps problem that demands a systematic solution, not just more sales hustle.
Here are three high-impact tactics you can use to start compressing your sales cycle right away:
- •Implement Mutual Action Plans (MAPs): A MAP is a simple, shared document outlining every step, deliverable, and timeline required from both your team and the buyer to get the deal done. It creates mutual accountability and completely eliminates the dreaded "so... what are the next steps?" ambiguity that kills momentum.
- •Automate Follow-ups and Nudges: Don't let deals stall because of human error or a busy inbox. Use automation to trigger follow-up emails, send internal alerts to reps when a deal hasn't moved stages, and remind prospects about upcoming deadlines you both agreed to in the MAP. This is a perfect example of using AI to amplify truth by ensuring process adherence.
- •Standardize Your Proposal and Contracting Process: Create templates and get your legal team to pre-approve clauses to slash the time spent on late-stage administrative hurdles. Every single day you save in legal review is a day you get closer to recognizing that revenue.
By applying a structured, data-driven approach, you can systematically pull the friction out of your sales process. Shifting from a reactive, chaotic motion to a proactive, predictable one can realistically compress a bloated 90-day cycle down to 60 days. This has a direct and immediate impact on your revenue velocity—the ultimate measure of a healthy, scalable growth engine.
Building Your 6-Week Revenue Growth Blueprint
Diagnosing the leaks is a critical first step, but the real win comes from building a repeatable system for growth. It’s time to stop analyzing and start acting. This is a clear, structured plan—inspired by our own 6-Week Revenue Growth Sprint—designed to drag you out of uncertainty and onto a predictable growth path.
This isn’t about guesswork or another "strategy" deck that collects dust. It's a methodical, week-by-week process for installing the operational discipline your business needs. We're turning abstract goals like "improve efficiency" into a concrete roadmap with owners, timelines, and measurable outcomes.
Week 1: The Data-Driven Foundation
You can't fix what you can't accurately measure. The entire process kicks off with an honest, unflinching look at your baseline performance. Week one is all about a comprehensive audit of your current go-to-market engine.
We pull the real, unfiltered data from your systems to answer the tough questions:
- •What’s your true lead response time, down to the minute?
- •What is your actual MQL-to-SQL conversion rate? No "maybes," just the hard number.
- •How long does a deal really spend languishing in each sales stage?
This work establishes the data-driven truth, stripping away perception from reality and giving us a clear, undeniable starting point.
Weeks 2-3: Implementing Foundational Fixes
With a clear baseline, we move fast to implement high-impact, foundational fixes. This phase is all about plugging the most obvious leaks with robust, automated solutions. We’re chasing the quick wins that immediately improve operational hygiene and speed.
We deploy automated lead routing to kill manual delays, lock in firm Service Level Agreements (SLAs) for every follow-up, and roll out CRM hygiene protocols. This is how your data transforms from a liability into a reliable asset.
This timeline shows exactly how we compress the sales cycle by surgically removing these critical bottlenecks.
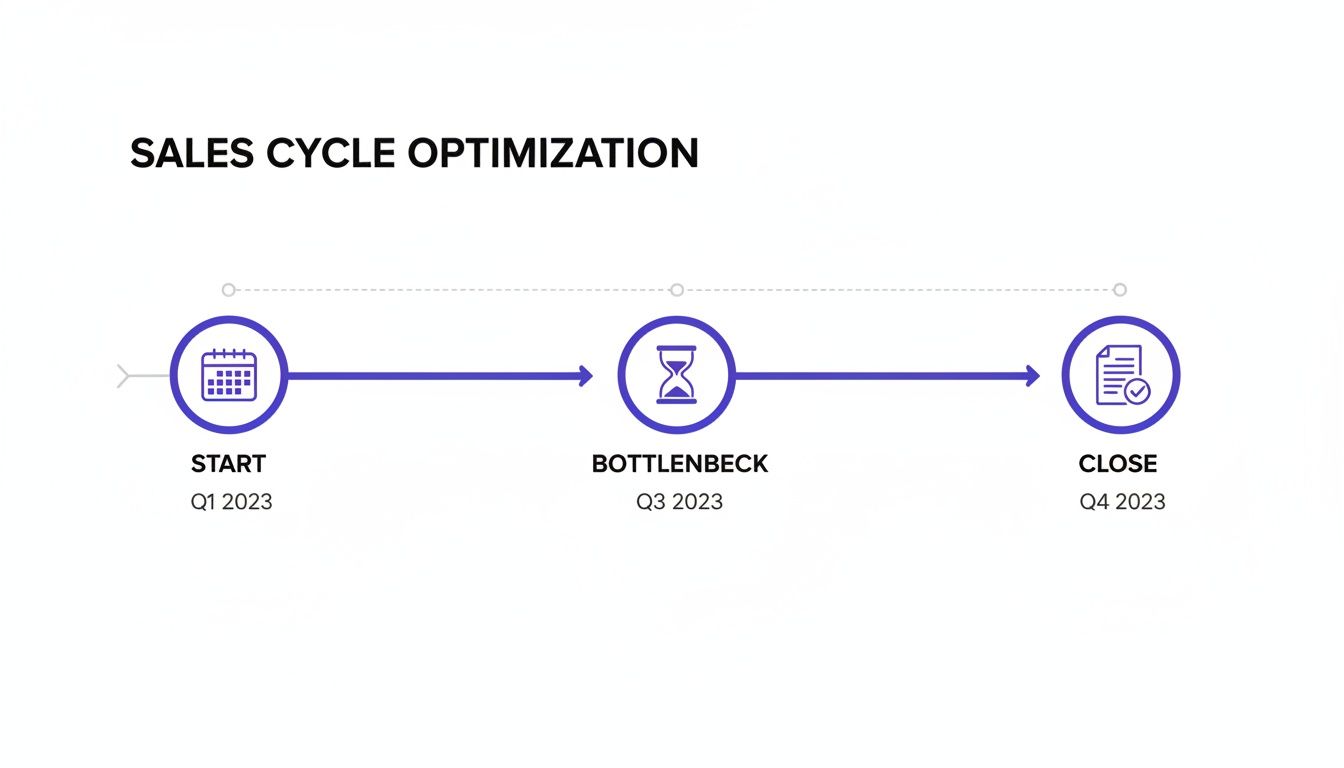
A sales cycle optimization timeline showing start, bottleneck, and close stages with quarterly targets.
When you visualize the entire process like this, it becomes painfully obvious where delays pile up—and how targeted fixes can accelerate the entire journey from a first touch to a closed deal.
Weeks 4-6: Alignment and Optimization
The final weeks are all about optimizing your sales process and cementing true alignment between your go-to-market teams. Now that everyone is working from the same verified data, we can fine-tune workflows and build real accountability. This is where you can learn more about achieving true revenue alignment.
By the end of Week 6, you won't just have a plan; you'll have a complete Revenue Growth Blueprint. This isn't some theoretical document. It's a prioritized roadmap with clear owners, timelines, and the estimated financial impact of every single initiative. It's your path forward.
Companies that complete this process see a 15–25% improvement in pipeline velocity. This isn't just theory; it's a system we build for businesses just like yours.
Your Questions, Answered
Straightforward answers to the tough questions B2B SaaS leaders ask when growth hits a wall. Let's get you from diagnosis to action.
Is My Stalled Growth a Market Problem or an Internal One?
While it’s easy to blame the market, the real problem is almost always internal. The quickest way to know for sure? Look at your direct competitors. If they're still growing while you’re flat, the issue isn't the market—it's your go-to-market engine.
Drill down into your own operational metrics. Benchmark your lead response time, sales cycle length, and pipeline conversion rates against industry best-in-class numbers. If you're lagging, you have an internal, fixable operations problem. A diagnostic sprint is the best way to quantify that gap and separate the market noise from your own operational weaknesses.
What Is the Most Important Metric to Prevent Revenue Stalls?
If you can only track one, make it Pipeline Velocity. Nothing else gives you a clearer, more immediate signal of future revenue health. It’s a powerful metric that combines the number of opportunities, your average deal size, and your win rate, all divided by the length of your sales cycle.
Think of it as the speedometer for your revenue engine. It tells you exactly how much qualified pipeline value is moving through your sales process every single day. A dip in velocity is your earliest warning that growth is about to stall, even if this quarter’s revenue looks fine. It lets you see the future before it happens.
Why Didn't Our New CRM Fix Our Stalled Growth?
Because technology is an amplifier, not a savior. A shiny new CRM can't fix a fundamentally broken process—it just helps you execute that broken process more efficiently. This is one of the most common and expensive mistakes we see.
Companies invest heavily in tools without first defining the strategy, the handoffs, the SLAs, and the workflows that make sales and marketing actually work together. A tool will only magnify what’s already there. If your system is inefficient, the tool will make that inefficiency faster. The right way to do it is to define and streamline the process first, then configure your technology to support it. Otherwise, you’re just pouring old problems into a new, expensive container.
Ready to stop guessing and start building a predictable growth engine? The Altior & Co. 6-Week Revenue Growth Sprint applies this diagnostic framework directly to your business, giving you a clear, actionable blueprint to reignite your growth. Learn how the 6-Week Revenue Growth Sprint can build this system for your business.