Stop guessing and start scaling SaaS revenue. This data-backed playbook shows you how to diagnose funnel leaks and drive predictable, measurable growth.
Scaling your SaaS isn't just about launching another big marketing campaign. It’s about a methodical, data-backed hunt for the hidden friction points gumming up your revenue engine.
The real gold is in the gap between what your team thinks is happening and what your CRM data proves is happening. Closing that gap is how you turn erratic growth into a predictable, scalable system. This guide gives you the framework to find that truth and act on it.
Uncovering The Hidden Leaks Stalling Your Growth
You’ve fought your way to the €8–10M ARR mark. First off, congratulations. But now, growth feels… different. It’s choppy, inconsistent, and way harder to predict.
This is a frustratingly common plateau. The problem isn't your product or how hard your team is working. It’s the invisible friction points that are silently killing your momentum.
This friction probably sounds familiar. Your sales cycles drag on for no apparent reason. Your pipeline looks healthy on paper but constantly under-delivers. There's a nagging disconnect between what sales and marketing are telling you.
You hear things like, “Oh yeah, we follow up on every single MQL.” But when you dig into the data, a different story emerges. It's not uncommon for sales leaders to report 80% follow-up compliance, but a quick CRM audit often reveals the truth is closer to 25%. This gap between perception and reality is exactly where your revenue vanishes.
Scaling isn’t about working harder; it's about seeing the truth in your data and acting on it with surgical precision.
Shifting from Reactive to Proactive
Most teams are stuck in a reactive loop, chasing symptoms instead of diagnosing the root cause. A missed quarter triggers a frantic push for more demos, but the broken conversion process that caused the miss goes untouched.
A proactive strategy starts with asking better questions. Instead of, "How do we get more leads?" you start asking, "What's our actual lead-to-opportunity conversion rate, and where, specifically, is the process breaking down?"
This mindset shift is critical. For instance, Gartner forecasts worldwide end-user spending on public cloud services, a key driver for SaaS, will grow 20.4% in 2024. For founders in this booming market, hidden revenue leaks from slow lead response times or poor pipeline coverage aren't just minor issues—they're incredibly costly missed opportunities.
"The difference between scaling and stalling is often found in the operational details everyone assumes are working fine. It’s the two-day lead response time, the undefined MQL criteria, or the deals stuck in a single stage for 45 days. Your CRM knows the truth."
Fixing these issues requires a systematic approach. A key metric for spotting these leaks is understanding the Lifetime Value of a Customer, which helps you quantify the long-term dollar impact of your funnel’s inefficiencies.
If you're ready to start digging, our guide on identifying and fixing sources of revenue leakage is the perfect next step. This diagnostic mindset is the foundation for building a revenue engine that doesn't just grow, but scales predictably.
Conducting a Truth-Finding Funnel Audit
To stop guessing and start actually scaling your SaaS revenue, you have to measure what's happening inside your funnel. Forget vanity metrics. Your entire growth story hinges on a handful of critical, often-overlooked numbers that are sitting in your CRM right now.
An honest, truth-finding audit is the only way to replace assumptions with undeniable facts.
This isn’t about spinning up complex analytics; it’s about building a simple diagnostic that tells the truth. We’re going from a vague feeling like "our sales cycle seems long" to pinpointing the exact stage where 90% of deals stall for over 30 days. This is the fundamental shift from reacting to problems to proactively solving them with data.
This is the classic journey from symptom to a data-backed reality.
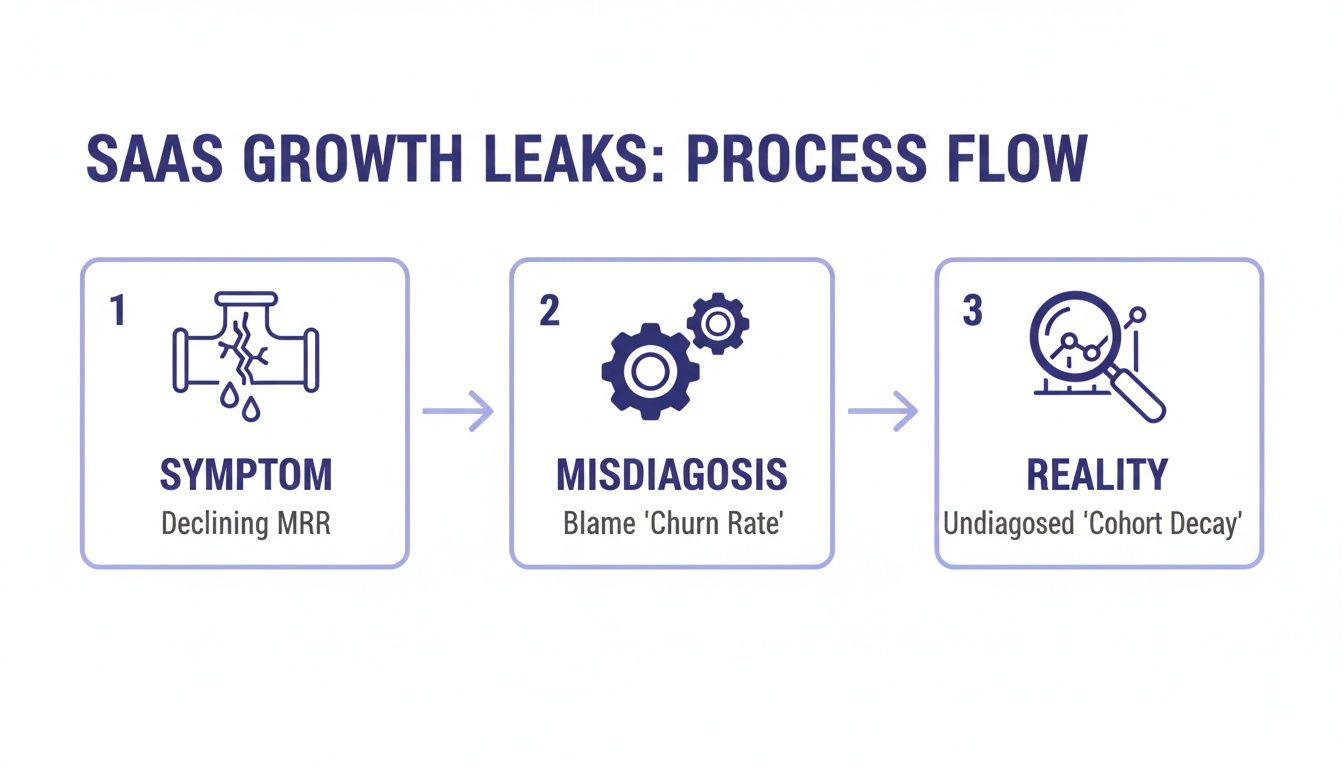
Process flow diagram showing SaaS growth leaks: declining MRR symptom, churn rate misdiagnosis, and cohort decay reality.
Teams often get stuck treating surface-level symptoms, like rising churn, when the real issue is a deeper operational failure—like a broken onboarding process that causes entire customer cohorts to decay over time.
The Five Metrics That Tell the Real Story
Your audit needs to laser-focus on five core areas. These metrics work together to give you a complete picture of your revenue engine's health, exposing the friction points that are quietly costing you money every single day.
Let’s break them down.
- •Lead-to-Opportunity Conversion Rate: This is the first major handoff. What percentage of the leads Marketing generates actually become qualified opportunities in the sales pipeline? A low number here is the earliest, clearest indicator of a sales and marketing misalignment.
- •Average Sales Cycle Length: How many days does it take to move a deal from creation to close? Even more telling: what's the average time a deal spends in each specific stage? This will immediately show you where your process gets bogged down.
- •Pipeline Coverage Ratio: This is your safety net. Do you have enough qualified pipeline to hit next quarter's revenue target? A healthy ratio is typically 3x to 4x your target, but many teams operate on wishful thinking with a ratio closer to 1.5x.
- •Average Lead Response Time: How long does it take for a new inbound lead to get a meaningful first touch from a sales rep? Research from HubSpot shows that waiting just one hour can decrease your odds of qualifying a lead by 7x. Yet, many teams average over 24 hours.
- •Sales Follow-Up Compliance: What percentage of leads get the number of follow-ups defined in your sales process? Sales leaders often think compliance is around 80-90%, but CRM data frequently reveals the truth is closer to a shocking 25-30%.
"Most SaaS companies don't have a lead generation problem; they have a lead follow-up problem. The highest-impact, lowest-cost revenue gain is hiding in the leads you've already paid for but failed to properly engage." - A RevOps Leader
Your Revenue Leak Diagnostic Checklist
To put this into practice, you need a simple framework. Use this checklist to audit the five most critical areas of your revenue funnel and see how you stack up against the benchmarks for a company at your stage. This isn't just about finding problems; it's about quantifying them so you can prioritize the fixes that will have the biggest financial impact.
| Metric to Audit | How to Measure (Example) | Warning Sign (Perception vs. Reality) | Target Benchmark for €10M ARR |
|---|---|---|---|
| Lead-to-Opp Rate | (Total Opps Created / Total New Leads) x 100 | Perception: "Marketing leads are weak." Reality: "Our lead qualification SLA is broken." | 10-15% (for inbound) |
| Sales Cycle Length | Avg(Date Won - Date Created) | Perception: "Prospects are slow to decide." Reality: "Deals stall 45 days in Stage 3." | < 60-90 days (mid-market) |
| Pipeline Coverage | (Total Open Pipeline / Revenue Target) | Perception: "We just need more pipeline." Reality: "Our pipeline is full of dead deals." | 3.0x - 4.0x |
| Lead Response Time | Avg(First Contact Time - Lead Create Time) | Perception: "We get back to leads quickly." Reality: "Average response time is 26 hours." | < 5 minutes (for inbound) |
| Follow-Up Compliance | (Leads with >X Activities / Total Leads) | Perception: "Reps are hitting their activity goals." Reality: "70% of leads get < 3 touches." | > 85% on defined sequence |
This diagnostic isn't a one-and-done project. It's an ongoing process. Once you have these numbers, you have your baseline—your roadmap for prioritization. It shows you exactly where to focus your efforts for the biggest impact on revenue.
For a deeper dive, our comprehensive SaaS funnel audit checklist provides a step-by-step framework to guide you through a full-scale analysis.
Prioritizing Fixes Based On Revenue Impact
So, your funnel audit is done. You’ve pulled back the curtain and the numbers are staring back at you. That lead response time you thought was 2 hours? It's actually 26. The lead-to-opportunity rate you were banking on at 15%? It's sitting at a humbling 8%.
Now what?
The natural reaction is to panic and try to fix everything at once. Don’t. That’s a surefire way to burn out your team while achieving next to nothing. The real game-changer is smart prioritization—it’s the line between frantic activity and focused, high-impact execution.
Here's the truth: not all problems are created equal. A slow lead response time and a few messy CRM fields are both issues, sure. But one is actively bleeding revenue every single day, while the other is a minor headache. To truly start scaling saas revenue, you have to get comfortable translating operational friction into dollars and cents.
A whiteboard shows 'REVENUE IMPACT' with a line graph and bar chart depicting increasing growth.
From Operational Metrics to Board-Level Conversations
This is where you elevate the conversation. The key is to model the financial cost of doing nothing. This simple act transforms a tactical problem into a strategic, board-level conversation that gets you the buy-in and resources you need.
It shifts the discussion from, "Our reps need to be faster," to, "Our 24-hour response delay is costing us an estimated €150,000 in lost ARR this quarter."
Suddenly, everyone is listening.
This financial modeling doesn't need a PhD in statistics. Start with some quick, back-of-the-napkin math to build your case.
- •Cost of Slow Lead Response: You get 200 inbound leads a month and your average deal is €10k ARR. What's the real cost of that 24-hour delay? Industry data consistently shows a 7x drop in qualification rate after the first hour. You can immediately model the potential revenue you're leaving on the table.
- •Value of Conversion Lift: What if you could bump your trial-to-paid conversion from 12% to 14%? For a SaaS business with 500 trials a month and a €5k ARR average, that seemingly small 2% improvement translates directly into an extra €50,000 in new ARR. Every single month.
"When you can walk into a leadership meeting and say, ‘Fixing this one handoff process between Marketing and Sales will unlock an estimated €250k in pipeline value this year,’ you’re no longer just an operator. You’re a strategic growth driver."
This approach lets you stack-rank your entire list of problems by their potential return. It forces you to focus your team’s precious time and energy on the fixes that will actually move the needle, delivering the biggest and fastest impact to your bottom line.
Building Your Prioritization Framework
A simple but incredibly effective way to visualize this is with an impact/effort matrix. Plot every leak you found in your audit based on two simple axes: its potential revenue impact (high/low) and the effort required to fix it (high/low).
Your first move should always be the high-impact, low-effort fixes. These are your quick wins. They build momentum and prove the value of this process.
| Priority | Fix Example | Revenue Impact | Implementation Effort |
|---|---|---|---|
| P1 | Implement automated lead routing (e.g., round-robin) with a 2-hour SLA. | High | Low |
| P2 | Create a shared dashboard for Sales & Marketing on MQL-to-Opp conversion. | Medium | Low |
| P3 | Clean up CRM data to identify and remove dead deals from the pipeline. | Medium | Medium |
| P4 | Re-train the sales team on a new qualification framework. | High | High |
This framework turns a messy to-do list into a clear, actionable roadmap. This is especially vital in high-growth environments. Take the Asia Pacific SaaS market—it exploded to USD 86,359.4 million in 2024 and is projected to clear USD 200 billion by 2030. For RevOps leaders operating in that kind of market, operational friction like a slow lead handoff isn't a small leak; it's a massive hole in the bucket that erodes scaling potential.
Once your priorities are locked in, you can go deeper. Our guide to effective revenue analytics will help you build the dashboards to track these high-impact metrics. This is critical—it ensures that when you roll out a fix, you can circle back and prove its financial impact with cold, hard numbers.
Implementing High-Impact Operational Changes
You’ve done the diagnostic work and your priorities are clear. Now for the part that actually moves the needle: execution. A plan is just a document until you translate it into real, operational changes that embed accountability directly into your systems. This is where the hard work of scaling SaaS revenue truly begins.
The goal isn't to boil the ocean. It’s to implement a few high-leverage fixes that deliver the fastest, most significant results. We’re talking about tactical shifts that immediately reduce friction and start plugging the leaks you identified. This isn’t about changing mindsets overnight; it’s about changing the systems that show what’s actually working.
Week 1: Automating Lead Routing and Setting SLAs
Your first move should be on the highest-impact, lowest-effort fix you found—which is almost always your lead response time. If your audit revealed a 24-hour average response, this is ground zero for lost revenue.
The solution is both technical and procedural. You need to configure automated lead routing in your CRM to instantly assign new inbound leads to the next available rep. This simple round-robin setup eliminates the manual "cherry-picking" or analysis paralysis that kills speed.
But the tool is only half the battle. You must pair it with a non-negotiable Service Level Agreement (SLA).
- •Lead Response Time SLA: All new inbound MQLs must get their first personalized touch (call or email) within 2 hours. No exceptions.
- •Measurement Criteria: Success = a reduction in average lead response time from 24 hours to under 2 hours within 3 weeks.
- •Ownership: The Head of Sales is on the hook for monitoring compliance via a real-time dashboard, and the RevOps manager owns the system's technical side.
This single change can have a dramatic impact on qualification rates. According to research from Salesforce, 78% of customers buy from the company that responds to their inquiry first. Waiting a day is the same as telling a prospect their business isn't a priority.
Weeks 2-3: Formalizing the Sales and Marketing Handoff
The next critical area to fix is the notoriously murky handoff between marketing and sales. This is where blame gets thrown around and revenue gets lost. The fix is to create a crystal-clear, system-enforced SLA that defines the rules of engagement.
This isn't just a document; it's a contract you build inside your CRM.
"Your CRM should be the single source of truth for your sales and marketing alignment. If the SLA definitions and handoff triggers aren't automated within the system, they're just suggestions that will be ignored under pressure."
The SLA must explicitly define what constitutes a Marketing Qualified Lead (MQL) and what actions must be taken when one is passed to sales. For example, an MQL might be "any lead that requests a demo and comes from a company with over 50 employees."
When marketing qualifies a lead, the system should automatically create a task for the assigned sales rep, starting the clock on their response time SLA. This builds a closed-loop system where accountability is tracked automatically. For a deeper look at the technical side, exploring automation workflows for RevOps can provide a practical blueprint for setting up these processes.
This is an example of an interface used for managing and routing leads effectively within a sales CRM.
This visual demonstrates how a well-organized system provides clarity on lead status, ownership, and next steps—all of which are essential for enforcing your new SLAs.
Weeks 4-6: Building Dashboards and Embedding Accountability
With your new processes live, the final step is making performance visible to everyone. You need to build and circulate a simple, shared dashboard that tracks the core metrics you're trying to improve. No hiding.
This dashboard becomes the centerpiece of your weekly sales and marketing check-in. It should track:
- •Average Lead Response Time: Is it trending down toward your <2 hour goal?
- •MQL-to-SAL Conversion Rate: What percentage of leads passed by marketing are being accepted by sales?
- •Sales Follow-Up Compliance: Are reps hitting the required activity levels on new leads?
This level of transparency kills the "he said, she said" arguments. The data is the data. The conversation shifts from blaming each other for bad leads to collaboratively asking, "Our MQL-to-SAL rate dropped by 5% this week. Why? Let's look at the cohort and figure it out together." A critical part of this visibility comes from ensuring your tools are properly connected; optimizing your process through effective CRM integration for sales teams is a powerful way to ensure data flows seamlessly.
By focusing on these operational changes, you transform your revenue engine from a set of manual, inconsistent processes into a predictable machine where accountability is built right into the system itself.
Building A Repeatable System For Growth

Three colleagues, two men and one woman, discuss a diagram on a large screen in an office.
Sustainable growth isn't built on heroic individual efforts or temporary fixes. True scalability happens when you build a repeatable system where your entire go-to-market team works from a single source of truth. After putting in the hard work on high-impact operational changes, this is where you make it permanent.
The operational fixes you've already made—automated lead routing, clear SLAs, shared dashboards—are the foundation. Now, it's about building the routines that turn these new processes into your company's muscle memory. This is the final step in moving from frantically plugging leaks to predictably scaling revenue.
Shifting From Finger-Pointing to Collaborative Problem-Solving
Your new, reliable data is the ultimate peacemaker. Suddenly, the weekly pipeline review meeting goes from a tense, blame-filled session to a productive, data-driven strategy huddle. The conversation is no longer about who is to blame for missed targets.
Instead, it's about looking at the numbers together and asking the right questions.
- •"Our MQL-to-Opportunity conversion rate dipped 3% last week. Let's drill into the source and see if a specific campaign is underperforming."
- •"Sales accepted 95% of marketing's leads. That's fantastic alignment. How do we replicate that success across other channels?"
- •"Our pipeline coverage is at 2.8x for next quarter, a bit shy of our 3.5x goal. What specific joint initiative can we launch to close that gap?"
This collaborative mindset is absolutely critical for winning in competitive markets. Take the AE-impacted Asia Pacific, where the SaaS market is exploding with a projected 22% CAGR. For marketing and sales leaders there, unifying around clean data isn't a best practice—it's a survival requirement. You can discover more insights about the APAC SaaS boom on electroiq.com.
"A repeatable system means that success isn't dependent on one superstar sales rep or one viral marketing campaign. It’s dependent on a process that everyone understands, trusts, and executes consistently because the data proves it works."
This system creates a powerful feedback loop. Better data sparks better conversations, which lead to smarter decisions, which in turn generate even better data.
Using AI and Automation to Amplify Truth
Now, with a solid foundation of truth, you can bring in technology to reinforce it, not to add complexity. AI and automation become powerful amplifiers for your newly disciplined system. Their job is to handle the grunt work, maintain consistency, and flag problems before they spiral out of control.
This is where AI stops being a buzzword and becomes a practical scaling tool.
- •Automated Follow-ups: Systems can ensure every lead gets the exact number of touches defined in your SLA, wiping out human error and forgetfulness. This is an example of an AI-amplified consulting model that ensures compliance at scale.
- •Deal Health Scoring: AI can analyze CRM activity—or the lack of it—to flag at-risk deals. For instance, it can automatically alert a sales manager when a high-value opportunity has had no new contact logged in over 10 days.
- •Predictive Forecasting: With a clean, reliable history, AI models can produce a far more accurate sales forecast. This gives leadership a real-time, unbiased view of revenue health, freeing you from relying on subjective rep estimates.
This isn't about replacing your team. It's about giving them guardrails and tools that make doing the right thing the easiest thing. By embedding these principles, you finalize the transition from a company running on frantic effort to one driven by an intelligent, scalable, and repeatable system for growth.
Your Path to Predictable Revenue Growth
Scaling a SaaS company from €8M to €20M ARR isn’t about discovering some magical growth hack. It’s a science, and it’s built on a foundation of operational discipline. The whole journey kicks off the moment you stop guessing and start confronting the hard truths hidden in your CRM data.
By walking through this playbook, you’ve learned how to diagnose the real bottlenecks that kill momentum. More importantly, you can now put a dollar figure on those leaks—a language every executive understands—and start implementing the operational fixes that build a repeatable growth engine. It’s about shifting from chasing symptoms to solving the root causes.
The core lesson is this: predictable scale comes from mastering the fundamentals.
Nailing your lead response times, optimizing conversion rates at each stage, and shortening your sales cycle are the foundational pillars that unlock sustainable, long-term growth. These aren't just metrics; they're the direct reflection of your revenue engine's health.
When you apply these data-backed principles, seeing a 15–25% improvement in pipeline velocity within six weeks isn't just possible—it's expected. Your next move isn’t to chase the latest marketing trend. It’s to look inward and begin your own diagnostic audit.
The truth is already sitting in your data. Now, it's time to act on it.
Frequently Asked Questions
Scaling a SaaS is a journey, and you’re bound to have questions. Here are some of the most common ones we hear from founders and RevOps leaders navigating that crucial €8M–€10M ARR stage, along with some straight-up answers.
What Are The First Signs Our SaaS Company Has A Revenue Leak?
The first red flags usually pop up in conversations long before they hit the P&L. You’ll hear things like the sales cycle is mysteriously getting longer, or marketing is celebrating a flood of new leads while the sales team is complaining about quality.
A classic sign is a pipeline that looks fantastic on paper but somehow never hits the forecast. But maybe the most telling signal is when you can't get straight answers to simple questions. If you ask, "What's our real conversion rate from a qualified demo to a closed-won deal?" and you get a story instead of a hard number from your CRM, you’ve almost certainly got revenue leaks hiding in plain sight.
How Quickly Can We See Results From Improving Our RevOps?
You don't need to wait a year to see a return. While building a fully mature, data-driven revenue operation is a marathon, not a sprint, you can get quick wins incredibly fast.
Something as simple as implementing automated lead routing and enforcing a strict SLA can immediately slash lead response times and give you a measurable lift in conversions within the first couple of weeks. By zeroing in on the most critical, data-backed priorities first, we typically see clients get a 15–25% improvement in pipeline velocity and key conversion metrics within a single 6-week sprint. The name of the game is building momentum.
Our Sales And Marketing Teams Are Not Aligned. Where Do We Start?
This is probably the single most common growing pain at this stage. Forget starting with meetings about "better communication"—start with the numbers. The best way to get alignment is to build a single source of truth with objective data that both teams have to look at.
Get both department heads in a room and have them hammer out a Service Level Agreement (SLA). This isn't just a handshake deal; it's a document that precisely defines what a Marketing Qualified Lead (MQL) is and what criteria a lead must meet to become a Sales Accepted Lead (SAL).
Once that's locked in, build a shared dashboard tracking the metrics that bridge their worlds: MQL volume, the MQL-to-SAL conversion rate, and—most importantly—the actual pipeline value being generated from marketing's efforts. When everyone is staring at the same objective data, the conversation has a funny way of shifting from finger-pointing to collaborative problem-solving.
Ready to stop guessing and start scaling with a proven, data-backed system? Altior & Co. helps B2B SaaS firms uncover and fix the revenue leaks stalling their growth.
Learn how the 6-Week Revenue Growth Sprint applies this playbook to deliver a clear path to predictable revenue. Book a call today.