Struggling with low funnel conversion B2B? This guide offers a proven, data-driven playbook to diagnose funnel leaks, fix processes, and boost close rates.
If you're dealing with a low funnel conversion B2B scenario, it means high-potential deals are slipping through your fingers right at the finish line. This isn't just about a few missed opportunities; it's a direct drain on revenue that quietly inflates your customer acquisition cost (CAC). Your team ends up working twice as hard for half the results.
The real problem is that qualified leads—people who have signaled clear intent—are failing to become customers. That points to a critical breakdown somewhere in the final stages of your sales process. Fixing it isn't about working harder; it's about building systems that show you what's actually working.
Confronting the Reality of Your B2B Sales Funnel
That nagging feeling you have that you should be closing more deals? You’re almost certainly right. For B2B SaaS and fintech companies, the path from a curious website visitor to a closed-won deal is a minefield of drop-off points. The brutal truth is that most funnels leak far more revenue than leaders ever assume, creating a massive gap between perceived performance and actual results.

Person pointing at a laptop showing data charts, with a 'Funnel Revenue LOSS' banner visible.
This isn’t just a feeling; the numbers back it up. B2B SaaS companies face some of the steepest conversion hurdles out there. According to HubSpot, the average SaaS website conversion rate is a sobering 2.6%. Think about that. For every 1,000 visitors, you might only get 26 leads to work with.
But here’s the good news: because the numbers are so small, even minor improvements deliver huge results. Lifting that conversion rate by just one percentage point can slash your CAC by 15–25%, making it one of the highest-leverage activities you can focus on. You can dig into these B2B sales conversion rate benchmarks to see exactly how you stack up.
The compounding effect of these leaks is staggering. A small drop-off at each stage quickly erodes your initial lead volume, leaving you with just a handful of deals from a massive top-of-funnel effort.
Typical B2B SaaS Funnel Leakage Benchmarks
| Funnel Stage | Industry Benchmark Conversion Rate | Leads Remaining (per 1,000 Visitors) |
|---|---|---|
| Visitor to Lead | 2.6% | 26 |
| Lead to MQL (Marketing Qualified) | 30% | 7.8 |
| MQL to SQL (Sales Qualified) | 40% | 3.1 |
| SQL to Opportunity | 50% | 1.55 |
| Opportunity to Closed Won | 25% | 0.39 |
Source: Adapted from industry data from HubSpot and Klipfolio.
As you can see, starting with 1,000 visitors and applying industry-average conversion rates, you're lucky to close even one deal. This is precisely why a leaky bottom-of-funnel is so devastating—it invalidates all the hard work and investment that came before it.
The True Cost of Inaction
The real danger here is complacency. A leaky bottom-of-funnel doesn't just mean lost deals today; it has a corrosive, compounding effect on your entire go-to-market engine. It tanks team morale, torches your marketing budget, and puts a governor on your company's growth trajectory.
Let's put some real numbers on it. Say your team is converting qualified opportunities at a 20% rate, but the benchmark for similar deals is 30%. You're leaving a full third of your potential revenue on the table. For a company with a €1 million qualified pipeline, that’s over €100,000 in lost revenue from a single cohort of deals. Gone.
"Sales leaders often believe their team is operating at 80% efficiency, but our diagnostic data consistently reveals the reality is closer to 40%. The disconnect comes from relying on anecdotal feedback instead of a single source of truth from their CRM." – Jake St-Amant, Founder at Altior & Co.
Moving from Guesswork to Quantification
To build a powerful business case for fixing this, you have to move beyond a vague sense of "we should be closing more." You need a precise, quantified understanding of where, why, and how much revenue is slipping away. It’s time to stop looking at vanity metrics and get ruthless about the numbers that actually move the needle.
You need to quantify these three areas immediately:
- •Opportunity-to-Close Rate: What percentage of qualified opportunities actually become customers? How does this month compare to the six-month rolling average?
- •Sales Cycle Length: How many days does it take to move a deal from creation to close? Is that number getting longer or shorter?
- •Lead Response Time: Forget what you think it is. What's the actual median time, in minutes, it takes for a rep to follow up with an MQL?
By putting hard numbers to these leaks, you transform a fuzzy "problem" into a specific, addressable challenge. This is the first real step toward building a predictable revenue engine—one where growth is the output of a finely tuned system, not just heroic, one-off sales efforts. Your goal is to establish an undeniable source of truth that galvanizes the entire team into action.
Building Your Diagnostic Toolkit to Uncover Funnel Leaks
You can't fix what you can't measure. That gut feeling that deals are slipping through the cracks is just a feeling until you prove it with cold, hard data. Before you can tackle a low funnel conversion B2B problem, you have to build a diagnostic toolkit that forces the truth out of your CRM. Forget the high-level vanity dashboards; it’s time to get your hands dirty and pull the specific reports that expose the friction in your revenue engine.
A diagnostic toolkit banner above a tablet displaying a dashboard, a pen, and sticky notes on a wooden desk.
This initial audit is all about creating a single source of truth. We're moving beyond anecdotes and assumptions to build an undeniable, data-backed case for what needs to change, pinpointing exactly where the revenue is leaking out.
The Disconnect Between Perception and Reality
Ask any sales leader, and they'll tell you their team is on top of it. The common perception is that MQLs are actioned almost immediately and the CRM is mostly accurate. But the data often tells a shockingly different story.
I've seen it time and again: leaders confidently report 80% follow-up compliance, but a deep dive into the CRM activity logs reveals the actual number is closer to 25%. This isn't about pointing fingers. It's about uncovering the systemic breakdowns that are silently killing deals before they even have a fighting chance. Your toolkit’s first job is to expose these gaps.
Uncovering Lead Handoff Delays
The moment a lead gets passed from marketing to sales is ground zero for funnel leakage. Any delay here is incredibly costly. A lead’s interest has a very short half-life, and every minute that ticks by slashes your odds of conversion.
To see where prospects are dropping off, you need to track the right lead funnel drop-off key metrics that actually reflect your sales process.
Your first move is to measure Lead Response Time. Jump into your CRM (whether it’s HubSpot or Salesforce) and build a report that calculates the time between when a sales rep is assigned a lead and when they log their first activity—be it a call, email, or meeting.
- •Metric to Track: Median Lead Response Time (in minutes).
- •What to Look For: For high-intent leads, you should be aiming for under 5 minutes. Anything over an hour is a massive red flag that screams "leaky bucket."
- •Report to Build: Create a custom "Time to First Contact" report, broken down by sales rep and lead source.
Auditing Sales Activity and Consistency
Inconsistent sales activity is another classic culprit behind poor conversion. Are your reps making enough calls? Are they sending follow-ups at the right cadence? Gut feelings don't cut it. You need to quantify their effort.
Build a sales activity report that tracks key engagement actions over the last 90 days. This gives you a clear baseline of what "normal" looks like and immediately highlights the outliers—both the over-performers and those who are falling behind.
Visualizing this data, like in a HubSpot sales analytics dashboard, makes it painfully obvious where deals are stalling and which reps might need some coaching on pipeline management.
"Your CRM data is the ultimate truth-teller. If an activity isn’t logged, it didn’t happen. Consistently auditing activity levels is the only way to ensure the process you designed on a whiteboard is the process being executed on the front lines." - Matt Bertuzzi, Author of "Gap Selling"
Diagnosing Poor CRM Data Hygiene
Finally, remember that your entire diagnostic effort is built on the quality of your data. Poor CRM hygiene makes accurate reporting impossible and camouflages critical funnel leaks. Common issues I see are deals stuck in past-due stages for weeks, missing contact info, or wildly inaccurate deal values.
Create a "CRM Health" dashboard with reports that automatically flag these data integrity issues. This isn't a one-off task; it's a continuous inspection process.
- •Stalled Opportunities: Run a report on all open deals with zero logged activity in the last 14 days.
- •Deals with No Next Step: Filter for any opportunity that doesn't have a future task or meeting scheduled. This is a deal destined to die.
- •Incomplete Contact Data: Identify key contacts that are missing essential info like a phone number or job title.
By building these specific, targeted reports, you’re creating a diagnostic toolkit that replaces assumptions with facts. This data-driven foundation is the crucial first step to plugging your revenue leaks for good. To get a head start, you can use our free revenue leak calculator to see just how much these small issues could be costing you.
Prioritizing Fixes with an Impact vs. Effort Matrix
You’ve done the diagnostic work. You have a list of all the places your revenue is leaking. The immediate impulse is to jump in and try to fix everything at once, but that’s a direct path to chaos and burnout.
The real challenge isn't just finding the problems; it's deciding which ones to tackle first to get the biggest bang for your buck. This is where you need to shift from being a firefighter to an architect. Instead of chasing the loudest alarm, you need a simple, logical framework.
The Impact vs. Effort Matrix is the perfect tool for this. It helps you turn a messy list of issues into a clear, actionable roadmap.
From a Problem List to a Prioritized Roadmap
The concept is brilliantly simple. You map each problem you've found onto a four-quadrant grid. The vertical axis represents the potential Impact on revenue, and the horizontal axis represents the Effort it’ll take to implement a fix.
This exercise isn't just about drawing boxes; it forces you to think critically about each problem. You move beyond gut feelings and actually quantify the potential upside versus the resources needed. It brings immediate clarity and gets the entire revenue team aligned on what truly matters most.
Here’s how the quadrants break down:
- •High Impact, Low Effort (Quick Wins): These are your number one priority. They deliver significant results with minimal resources and build momentum fast. This is where you start.
- •High Impact, High Effort (Major Projects): These are the big, strategic initiatives. They require serious planning and resources but promise substantial long-term gains.
- •Low Impact, Low Effort (Fill-ins): Think of these as minor optimizations. Tackle them when you have spare capacity, but don't let them distract from the bigger goals.
- •Low Impact, High Effort (Time Sinks): Avoid these at all costs. They eat up valuable time and money for negligible returns. Deprioritize or ignore them completely.
Putting the Matrix into Action
Let’s get practical. Imagine your diagnostic work uncovered three classic B2B SaaS funnel leaks: slow lead response times, inconsistent sales follow-up, and a clunky, outdated CRM.
First, let's look at automating lead routing with a strict 5-minute SLA. This is a textbook quick win. The impact is massive—companies that respond to leads within an hour are nearly seven times more likely to have meaningful conversations. The effort? Relatively low. It’s often just a few hours of configuration in your HubSpot or Salesforce instance.
"The difference between a five-minute and a 30-minute lead response time isn't incremental—it's exponential. Data consistently shows that the odds of converting a lead drop by over 80% after the first five minutes have passed." — James Oldroyd, MIT Lead Management Study
Next up: inconsistent sales follow-up. Building out standardized email templates and call scripts is another high-impact, low-effort fix. It immediately ensures every prospect gets a consistent, high-quality experience, which directly lifts engagement rates across the board. For example, we helped Company A increase their demo-to-trial conversion from 8% to 14% in 4 weeks simply by implementing a consistent 3-step follow-up sequence.
Finally, what about that outdated CRM? A full migration is undoubtedly a high-impact project that could unlock huge efficiencies. But it's also a very high-effort initiative, requiring months of planning, data migration, and team training. This falls squarely into the "Major Projects" quadrant. It’s something you schedule as a longer-term strategic goal, not an immediate fire to put out.
By mapping each issue, you create a clear order of operations. You start with the quick wins to immediately boost your bottom-of-funnel conversion metrics, building credibility and momentum for the bigger, tougher projects ahead. For more ideas on how to structure these improvements, check out our guide on holistic conversion optimisation.
This approach ensures your resources are always focused where they can deliver the greatest financial return.
Executing a 6-Week Revenue Growth Sprint
A great plan is worthless without disciplined execution. Once you've mapped your funnel leaks and prioritized them with the impact vs. effort matrix, it's time to turn that roadmap into action. This isn't about launching a dozen initiatives at once. It's about a focused, time-boxed sprint designed to deliver a measurable lift, fast.
Welcome to the 6-Week Revenue Growth Sprint. This is our playbook for a structured, accountable process that implements your highest-priority fixes and moves the needle on your low funnel conversion B2B metrics. A sprint provides a clear timeline, assigns ownership, and forces a disciplined focus on outcomes over activity.
The whole point is to turn a chaotic list of problems into a clear, sequential plan. You’ll tackle the quick wins first to build momentum for the bigger projects down the line.
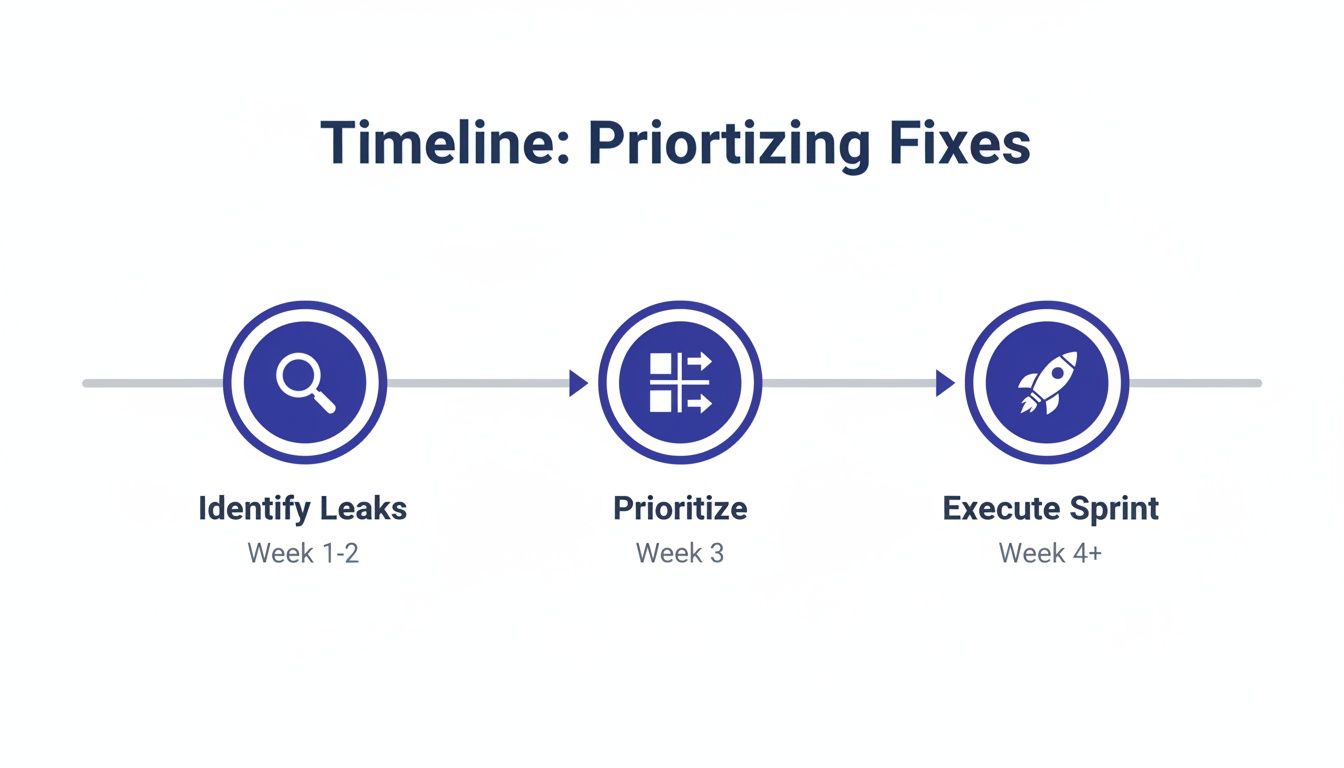
A timeline visualizes the process of identifying leaks, prioritizing tasks, and executing sprints for fixes.
Weeks 1-2: The Technical Quick Wins
The first two weeks are all about building momentum. The focus is exclusively on the high-impact, low-effort technical fixes you already identified. These are the foundational changes—cleaning up data, automating broken handoffs—that set the stage for everything else.
The goal here is immediate impact. For example, a HubSpot study showed that companies automating lead routing see significant boosts in sales team productivity. By tackling these system-level fixes first, you clear out the operational drag that holds your team back.
- •Implement Lead Routing Automation: Set up your CRM to automatically assign new high-intent leads to the right rep in under five minutes. This one change can slash your lead response time.
- •Deploy CRM Cleanup Rules: Build automated workflows to flag stale opportunities (e.g., no activity in 14 days) or deals missing critical data like a ‘next step’ date.
- •Launch Basic Engagement Sequences: Create a simple, two-step email sequence for all newly assigned leads. This ensures immediate, consistent follow-up before a rep even makes a call.
Weeks 3-4: Process Adoption and Coaching
With the technical foundation in place, the next two weeks pivot to people and process. This is where you roll out the new workflows and give your team the coaching they need to actually adopt them. Technology is only half the battle; real change happens when your team's habits align with the new system.
This phase is about embedding new behaviors. It’s not enough to build new templates; you have to train your sales team on why they’re better and how to use them to close more deals.
True revenue operations isn't about buying more software. It's about getting your people, process, and technology to work in harmony. The tech facilitates, but the process and people deliver the results.
Your key activities for this phase include:
- •Targeted Sales Coaching: Run role-playing sessions on handling the common objections you uncovered during the diagnostic phase.
- •Roll Out New Engagement Templates: Introduce and train the team on standardized email templates and call scripts built to address specific pain points.
- •Update Your Sales Playbook: Document the new SLAs, lead management rules, and CRM hygiene standards. Make it the official source of truth.
Weeks 5-6: Measurement and Iteration
The final two weeks are for measuring, reinforcing, and planning what's next. You’ll dig into the initial data, celebrate the early wins, and spot any areas that still need tweaking. The goal is to solidify the new workflows and prove their value with hard numbers.
Success here is a measurable lift in your key metrics. You should be aiming for a 15–25% improvement in pipeline velocity or your MQL-to-SQL conversion rate within this six-week window. That data makes the business case to turn these changes into permanent process. As you analyze performance, it's also a great time to sharpen other skills, like improving your revenue forecasting with this newly reliable data.
This phase ensures the sprint's impact lasts. By embedding the new processes and continuously monitoring performance, you shift from a one-time fix to a culture of ongoing optimization.
To help you visualize this, here’s a high-level template you can adapt. It lays out the key actions, owners, and success metrics for a structured sprint.
Sample 6-Week Funnel Conversion Sprint Plan
| Week | Key Focus | Example Actions | Success Metric |
|---|---|---|---|
| 1 | Tech Foundation - Triage | - Automate lead routing for demo requests. - Build CRM reports for stale deals. | - 95% of demo requests routed <5 mins. - Stale deal report live. |
| 2 | Tech Foundation - Cleanup | - Launch hygiene workflows (e.g., flag deals w/o next steps). - Implement basic lead nurture sequence. | - 80% of active deals have a next step. - 100% of new MQLs get first touch email. |
| 3 | Process Rollout & Training | - Train sales team on new CRM rules & SLAs. - Introduce new email/call templates. | - 100% team training completion. - 75% adoption of new templates. |
| 4 | Coaching & Reinforcement | - Run role-playing sessions on objection handling. - Live call coaching & deal reviews. | - Qualitative feedback from managers. - Improvement in call-to-meeting rate. |
| 5 | Initial Measurement | - Analyze lead response time & MQL-to-SQL rate. - Review template performance data. | - Lead response time reduced by 50%. - MQL-to-SQL rate increased by 10%. |
| 6 | Review & Plan Next Sprint | - Present findings & ROI to leadership. - Identify next bottleneck to tackle in Sprint 2. | - 15-25% overall lift in target metric. - Next sprint priorities approved. |
This structured approach transforms a vague goal like "improve conversion" into a concrete, week-by-week action plan that drives real results. Expect a 15-25% improvement in pipeline velocity within these 6 weeks.
Building a Culture of Continuous Funnel Optimization
The 6-week sprint wraps up, but that lift is only the start. Tackling low bottom-of-funnel conversion in B2B SaaS or fintech isn’t a one-off project—it’s a shift in your team’s DNA. Instead of jumping from firefight to firefight, you create a proactive routine where data drives every move.
Embedding new processes and SLAs into your daily rhythm is critical. Pipeline reviews must pivot from gut-feel to CRM-backed reality. Every discussion hinges on the metrics that truly signal health—or risk—in your revenue engine.
Establishing Your Post-Sprint Monitoring System
To keep progress alive, track just a handful of “vital signs” rather than drowning in dozens of metrics. These indicators give you an instant read on whether your go-to-market machine hums along:
- •Weekly Pipeline Health Checks: A 30-minute meeting to scan key figures—sales cycle length, opportunity-to-close rate, and stalled deal count.
- •Monthly Performance Analysis: A deeper look at trends, benchmark comparisons, and the next micro-bottleneck you’ll tackle.
This dashboard from Salesforce shows how to plot close rate and cycle trends side by side. When leadership sees those charts, conversations shift from “I think” to “I know.”
Making Data the Default Language
Optimization takes root when insights aren’t hidden at the top. Every rep should understand why replying in under 5 minutes triples connection odds. That kind of clarity fuels buy-in and accountability.
Implement robust call handling best practices and capture every interaction. Those frontline observations feed back into your playbook—fine-tuning scripts, automations, and handoff rules.
“A common failure point is treating funnel optimisation as a project with an end date. The best RevOps teams treat it like a product—one that is never 'done' but is continuously iterated upon based on user (i.e., sales team) feedback and performance data.” – Latif Nanji, CEO of Roadmunk (acquired by Appfire)
Once data drives the dialogue, managers stop asking “What’s the update on this deal?” and start probing “What do the numbers say is the next best action?” That small language shift swaps heroic firefights for a repeatable, scalable system.
From One-Time Fix to Continuous Improvement
Your six-week push proved focused effort pays off. Now shrink that cycle into an ongoing cadence:
- •Quarterly Bottleneck Hunts: Carve out time each quarter to diagnose a specific segment of your funnel.
- •Regular Process Audits: Every six months, review your sales playbook and CRM workflows to keep them aligned with evolving goals.
- •Celebrating Data-Driven Wins: Shine a spotlight on team members who uncover insights or streamline a process.
Lock these rituals into your calendar and you’ll spot—and solve—tomorrow’s challenges before they become crises. For a deeper look at how the pieces fit together, check out our guide to revenue intelligence. This approach cements your sprint gains as the new, sustainable baseline for growth.
Adapting Your Funnel for Global Markets
Expanding your B2B SaaS or fintech company into new international territories is a huge milestone. But it’s also where a rigid, one-size-fits-all sales funnel can completely fall apart. The RevOps framework that crushes your numbers in North America or Europe can fail spectacularly when you drop it into a different cultural and business context.
Nowhere is this more obvious than in the Asia-Pacific (APAC) region. I’ve seen countless scaling companies charge into this market, assuming their standard playbook will work, only to hit a wall of frustratingly low funnel conversion. The problem isn't a lack of interest—it's a fundamental mismatch with how buyers in the region actually operate.
Why Speed-to-Lead Can Backfire in APAC
In Western markets, speed is everything. A fast lead response time is one of the most reliable predictors of closing a deal. But in many APAC cultures, that aggressive, speed-focused approach can come off as pushy and transactional. It can actually undermine the very thing you need to build: trust.
The data tells a clear story. According to Gartner, B2B conversion rates in APAC often hover between 0.5% to 2%, a world away from the global benchmark of 2–5%. This isn't just a small dip; it's a massive performance gap. It's directly tied to unique regional buying habits, like much longer evaluation periods averaging 13.2 months, bigger buying groups with 12.8 decision-makers, and vendors being pitted against an average of 5.16 competitors.
For companies trying to crack this market, the lesson is clear: your traditional funnel acceleration tactics are dead on arrival. You can learn more about these sobering regional conversion rate benchmarks to get the full picture.
This reality requires a hard pivot away from pure velocity. Forget optimizing for the fastest response. You have to optimize for depth, patience, and credibility.
Shifting from Velocity to Value
To win in markets like APAC, you have to redesign your entire engagement strategy. It's about building trust over a longer, multi-touchpoint journey, not rushing to a demo. Your RevOps framework has to be flexible enough to handle this completely different rhythm.
Here’s how to start adjusting your approach:
- •Invest in Local Partnerships: Find reputable local resellers or consultants. Aligning with them gives you instant credibility and helps you navigate complex cultural nuances. Their endorsement is a powerful trust signal for a cautious buying committee.
- •Lengthen Your Nurture Sequences: A standard 5-touch email sequence isn't going to cut it. You need to build longer, more educational nurture streams that deliver real value over several months. This shows expertise and commitment without demanding a quick decision.
- •Prioritize Relationship Building: Coach your sales team to invest more time in discovery and rapport-building. The goal of the first few calls shouldn't be to qualify and push for a demo. It should be to understand, educate, and establish a genuine connection.
"When entering a new global market, your first job isn't to sell; it's to learn. The companies that succeed are the ones that adapt their process to the customer's buying culture, not the other way around." – Global SaaS Expansion Advisor
Ultimately, you have to treat each region as its own distinct market. Your systems, processes, and playbooks must reflect these local realities. This ensures that when you're fixing low funnel conversion b2b issues, your solution is contextual and effective, not just a copy-and-paste job that’s doomed to fail.
Answering the Tough Questions About Funnel Conversion
When you start digging into a leaky B2B funnel, the same critical questions always pop up. Let's tackle the ones we hear most often from founders and revenue leaders who are in the trenches.
What's a Realistic Conversion Rate Lift?
So you've committed to a focused, 6-week sprint. What can you actually expect to see?
Every business is different, of course, but aiming for a 15–25% improvement in one key bottom-of-funnel metric is a very solid, achievable goal. That could be your MQL-to-SQL rate, but the real money is often in the Opportunity-to-Close rate. The trick is to pick a single, high-leverage metric and obsess over it. That's how you get clear, measurable progress instead of just spinning your wheels.
How Do I Get the Sales Team to Actually Do This?
Let's be honest, new processes and stricter SLAs often feel like a top-down mandate to a sales team. The key to getting genuine buy-in is to answer the question they're all thinking: "What's in this for me?"
You have to frame the changes around things that directly fill their pockets.
- •Better Leads, Less Junk: Show them how better data hygiene and smarter routing mean they waste less time chasing dead ends and spend more time talking to people who are actually ready to buy.
- •Faster Deals, Faster Commission: Walk them through how new templates and follow-up cadences will help them push deals across the finish line quicker. Faster deals mean more commission checks, sooner.
When it’s about making their job easier and more lucrative, you’ll get champions, not resistance.
Who Runs This if We Don't Have a RevOps Team?
No dedicated RevOps function? No problem. The worst thing you can do is dump it all on one person's plate.
Instead, pull together a small, empowered "tiger team." This isn't a committee; it's a strike force. It should include the founder or head of sales, a key person from marketing, and whoever holds the keys to your CRM. This structure creates shared accountability and brings different perspectives to the table, giving the sprint the focus and ownership it needs to succeed.
Ready to stop diagnosing and start fixing? The team at Altior & Co. uses this exact playbook in our 6-Week Revenue Growth Sprint to find and plug the revenue leaks that are holding your business back.