Conduct a go to market audit to fix revenue leaks in your B2B SaaS GTM strategy. Our guide provides a clear framework, benchmarks, and actionable steps.
A go-to-market audit isn't just another report. It's a deep-dive, comprehensive review of your entire revenue engine, specifically designed to find the hidden friction points and leaks that your standard dashboards are built to miss. For B2B SaaS companies, this means moving beyond surface-level metrics to diagnose the real root causes of slow growth, missed targets, and pipeline inefficiency.
Your GTM Strategy Is Leaking Revenue—You Just Can't See It Yet
If you're leading a B2B SaaS or fintech company hovering around the €8–€10M ARR mark, you probably feel like your Go-To-Market (GTM) machine is humming along. Your CRM dashboards show activity, deals are closing, and everyone seems busy. But beneath that surface, a dangerous gap is widening between what your systems report and what's actually happening on the ground.
This gap is precisely where revenue quietly bleeds away. It's not one catastrophic failure; it's a series of small, almost invisible friction points that compound over time. Think of it as death by a thousand tiny cuts, slowly draining your growth potential.
The Perception vs. Reality Gap
The core problem is that most scale-ups run on assumptions, not truth. A sales leader might report that 80% of marketing qualified leads (MQLs) are followed up within the 24-hour SLA. But when you dig into the actual CRM timestamps, as we often do for clients, the reality is frequently closer to 25%, with many of your best leads waiting days for a first touch. This is where a go-to-market audit becomes your most valuable diagnostic tool.
This isn't a fault-finding mission. It’s about uncovering the ground truth of your revenue operations. It's built to answer the questions that keep founders and revenue leaders awake at night:
- •Lead Handoffs: How long does it really take for a qualified lead from marketing to get a first touch from sales? Not what the SLA says, but what the data proves.
- •Data Integrity: Are your CRM fields actually populated correctly? Or is messy, incomplete data making your reports unreliable and crippling your team's efficiency?
- •Team Alignment: Do sales and marketing genuinely share the same definition of a "qualified lead," or are they operating with conflicting goals that create friction at the handoff?
"A lack of a regular audit cadence slows down your entire GTM motion," notes a recent Salesforce report on RevOps. "Sales teams miss SLAs. Hot leads sit in inactive queues. When there’s no audit trail, even small errors can cause major setbacks."
This isn’t about blame; it’s about gaining clarity. Without it, you're making strategic decisions based on flawed information. You might pour more budget into a marketing channel that looks like it's working, only to find out those leads are dying on the vine because of slow sales follow-up. This is exactly how even successful companies hit an unexpected growth plateau.
Understanding your true metrics is the critical first step. It sets the foundation for fixing everything else, including essential elements like your pipeline coverage strategy. This guide is a blueprint for conducting that audit, showing you how to move from assumption-based management to a system of predictable, scalable growth built on data-driven truth.
Scoping Your Audit and Gathering the Right Data
Before you can fix anything, you need a clear map of the territory. The single biggest mistake I see companies make in a go-to-market audit is trying to boil the ocean. They analyze every metric under the sun, ending up with a mountain of data but zero actionable insights. A successful audit always starts with a tight, ruthlessly focused scope.
Your first job is to build a data foundation that tells the ground truth about your GTM motion. This isn't about vanity metrics like website traffic or the raw number of MQLs. It's about getting your hands on the raw, time-stamped data that shows exactly how a lead stumbles, sprints, or crawls from their first touchpoint all the way to a closed deal.
This initial phase is all about defining the boundaries. Which part of the funnel are you going after first? Is it the top-of-funnel lead management chaos? The mid-funnel opportunity conversion black hole? Or the post-sale expansion engine that isn't firing? Start where you feel the most pain—where you suspect the biggest leaks are happening.
Establishing Your Data Extraction Plan
Once your scope is locked in, it’s time to pull the essential data from your core revenue systems. This isn’t a simple matter of exporting a few standard reports. You need to dig deeper and extract the specific fields that let you reconstruct the entire customer journey with precision.
You'll primarily be working across three platforms:
- •Your CRM (like HubSpot or Salesforce): This is ground zero for deal stages, opportunity data, and sales activities.
- •Your Marketing Automation Platform (like Marketo or Pardot): Here you’ll find lead creation details, campaign attribution, and those critical MQL timestamps.
- •Your Sales Engagement Tools (like Salesloft or Outreach): These platforms hold the keys to sales activity—email opens, call connections, and sequence engagement.
The demand for this kind of deep-dive analysis is exploding. The advanced analytics market in the Middle East and Africa (MEA), which directly supports these GTM audits, hit USD 3,817.2 million in revenue and is projected to keep climbing. This just underscores the urgent need for data-driven tools to audit revenue funnels and pipeline coverage for scaling companies. You can discover more about these market trends and their impact on Grandview Research.
Focusing on Ground-Truth Metrics
Let's be blunt: the quality of your audit is 100% dependent on the quality of your data. Dirty, incomplete, or inconsistent data will send you down the wrong path, leading to flawed conclusions and wasted effort. That's why establishing strong CRM audit and data hygiene practices before you start analyzing anything is non-negotiable.
Your data extraction plan has to prioritize metrics that reveal two things: time and conversion. Volume is interesting, but time and conversion are where the money is.
Before you pull a single report, you need to create a checklist of the essential data you'll need to collect. This ensures you have a consistent and complete dataset to work from. Here's a look at what that checklist should cover.
Essential Data Checklist for Your GTM Audit
| Data Point | Primary Source | Why It Matters |
|---|---|---|
| Lead Creation Date & Time | Marketing Automation / CRM | The exact moment a lead entered your ecosystem; the starting gun for your entire funnel. |
| MQL Timestamp | Marketing Automation / CRM | The precise time a lead met the criteria to be passed to sales. The MQL-to-SAL clock starts here. |
| First Sales Activity Timestamp | Sales Engagement / CRM | The first logged call or email from a salesperson. This measures your speed-to-lead. |
| Stage Entry & Exit Dates | CRM | The dates for every single stage in your sales process. This is how you calculate stage velocity. |
| Deal Outcome | CRM | Closed-won, closed-lost, or disqualified. You need the "why" behind each outcome. |
| Lead Source & Channel | Marketing Automation / CRM | Tells you which GTM motions are actually generating pipeline, not just leads. |
This checklist is your starting point for building a reliable data foundation. Without these core data points, you're essentially flying blind, unable to accurately diagnose bottlenecks or measure the impact of your improvements.
Key Takeaway: The single most powerful dataset in any GTM audit is your collection of timestamps. According to research cited in SaaStr, the time elapsed between key stages—like MQL to first contact—is where most revenue opportunities are won or lost.
Pulling all this data together can feel tedious, but it's the only way to establish an accurate baseline of performance. This baseline becomes your snapshot, the "before" picture against which you'll measure the impact of every change you implement. It’s what transforms your audit from a theoretical exercise into a practical tool for driving real, measurable growth. Without it, you’re just guessing.
Diagnosing the Leaks in Your Revenue Funnel
With clean, organized data in hand, it’s time to put on your detective hat. This is where a go-to-market audit shifts from data collection to diagnosis—connecting the dots between raw numbers and real business problems. You're not just looking at metrics anymore; you're hunting for the specific friction points where revenue is quietly escaping.
This part of the process involves running a series of diagnostic tests on your funnel. Instead of getting lost in dozens of KPIs, we’ll focus on the five areas that have the biggest impact on your revenue engine. Think of these as the primary systems of your GTM motion; if one is off, the whole machine suffers.
The Five Core Diagnostic Tests
Your analysis needs to be structured around answering specific, high-impact questions in each of these five domains. This isn’t about vague exploration. It's a targeted investigation to find hard evidence of leaks.
Here are the critical areas to dissect:
- •
Lead Velocity: How fast are leads actually moving through the early stages? The key diagnostic question here is, "What's the average time between a lead becoming an MQL and an SDR making first contact?" A delay at this stage is often the single biggest, and most fixable, revenue killer.
- •
Conversion Rates: Where are deals truly dying? You need to ask, "What percentage of our discovery calls actually convert to demos?" This pinpoints weaknesses in your early-stage sales process or value proposition.
- •
Sales Cycle Length: How long does a deal really take to close, and is it getting longer? Track the average time from opportunity creation to closed-won. A creeping sales cycle is a classic sign of process friction or a weakening value prop.
- •
Pipeline Coverage: Do you have enough qualified opportunities in the works to hit your future targets? This isn't just about the total volume but the health, quality, and age of your pipeline.
- •
Sales Activity: Is your team focused on high-impact tasks? A crucial question is, "What percentage of a rep's time is spent on non-selling activities versus active engagement with prospects?" Bloated admin time is a silent killer of productivity.
We once worked with a SaaS company whose dashboards looked perfectly healthy. But by analyzing CRM timestamps, we discovered a 48-hour average delay in the handoff from marketing to sales. Fixing this single process gap unlocked 20% more pipeline from their existing leads within a single quarter.
The steps of scoping, gathering, and baselining your data are the foundation that makes these diagnostics possible.
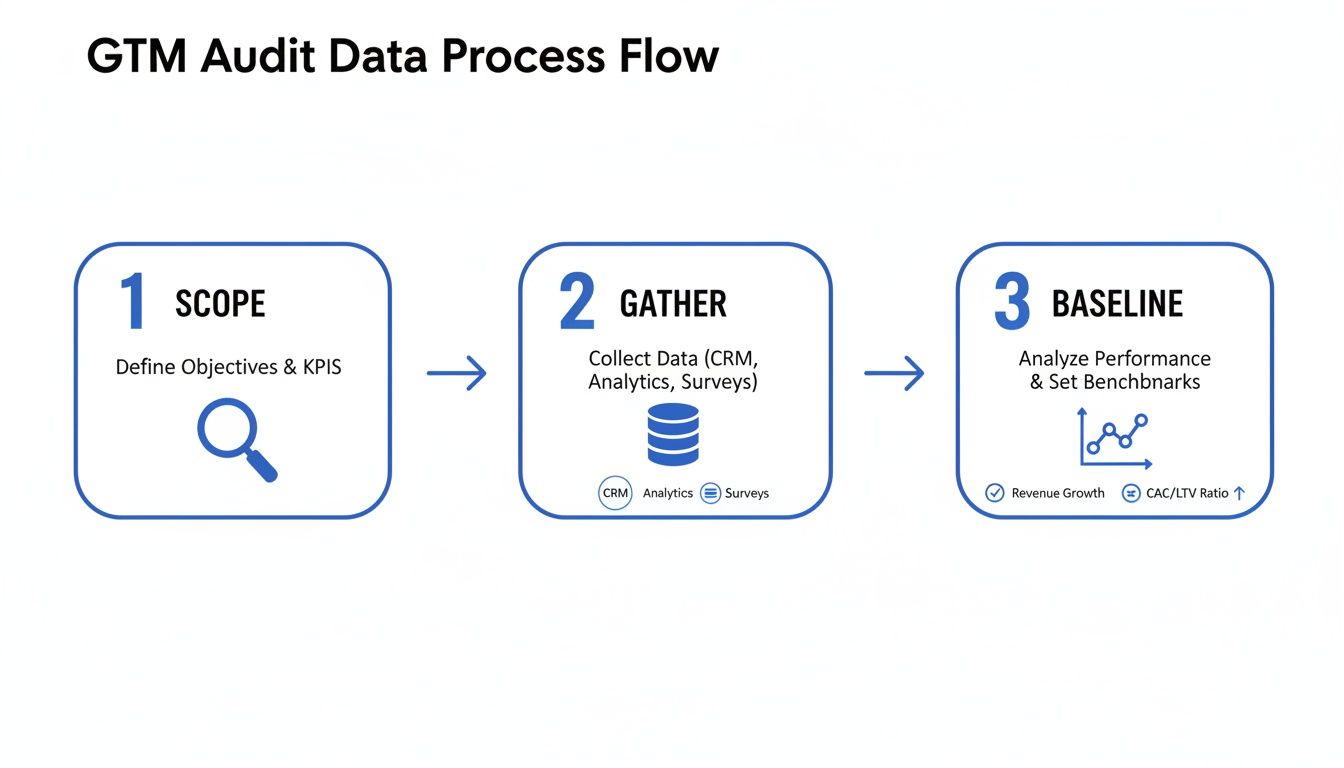
A Go-to-Market (GTM) audit data process flow with three steps: Scope, Gather, and Baseline.
This structured flow ensures your diagnostic tests are built on solid ground, making your findings credible and, most importantly, actionable.
Uncovering the Truth in Your Funnel Metrics
Your goal during this diagnostic phase is to find the gap between perception and reality. Sales leaders might feel their team is highly responsive, but the data often tells a different, more humbling story. It’s these discrepancies that highlight the most urgent opportunities for improvement.
The good news is that this level of analysis isn't just for enterprise giants anymore. The growing accessibility of cloud-based tools is making it possible even for smaller, leaner teams to punch above their weight.
For a deeper dive into the specific metrics to analyze, our comprehensive SaaS funnel audit checklist provides a step-by-step guide.
From Diagnosis to Proactive Prevention
A truly effective audit doesn't just look at past performance; it helps you anticipate future problems. That's why a proactive approach should also consider strategies for predicting customer churn. By understanding the leading indicators of why customers leave, you can reinforce weak points in your GTM motion long before they become critical issues.
Ultimately, this diagnostic process transforms abstract data into a compelling story about your business. It moves you from "we think this is a problem" to "we know this is a problem, and here's the data to prove it." This evidence-based approach is essential for getting the buy-in needed to make meaningful changes and start building a more predictable revenue engine.
Building Your Revenue Growth Blueprint

Overhead view of hands working on a revenue growth plan document with graphs and a laptop.
An audit that just dumps a long list of problems on your desk is useless. It’s an interesting report, maybe, but it’s not a tool for growth. The real value comes when you translate those diagnostic findings into a prioritized, actionable roadmap. This is your Revenue Growth Blueprint—a clear, no-nonsense plan that bridges the massive gap between knowing what’s broken and actually fixing it for good.
This blueprint is what separates insight from impact. It forces you to move beyond vague goals like “improve follow-up times” and commit to specific, measurable tasks with undeniable accountability.
From Vague Problems to Specific Fixes
The heart of a powerful blueprint is mapping every single issue you’ve uncovered to three non-negotiable components: a precise action, a designated owner, and a time-bound Service Level Agreement (SLA). This simple framework is designed to eliminate ambiguity and create a culture of ownership. No more finger-pointing.
So, instead of a fuzzy objective like "increase lead conversion," your blueprint gets brutally specific:
- •Action: Implement an automated, round-robin lead routing system in HubSpot for all inbound demo requests.
- •Owner: Head of RevOps.
- •SLA: All new inbound leads must receive a first touch (email or call) within 2 hours of submission.
This level of detail makes the task impossible to ignore. It creates a clear contract for execution and a simple way to measure whether the fix is actually working.
“Modern GTM teams run complex revenue operations across multiple tools. Lead routing, matching, SLAs, and scoring are just a few of the processes that must work together. When something goes wrong, revenue is on the line.” — HubSpot, State of RevOps Report
The power here is in the directness. You're turning a complex go-to-market audit into a series of manageable, high-impact projects that the entire revenue team can see, understand, and rally behind.
GTM Issue vs Actionable Fix Sample Blueprint
Here’s a quick look at how you can translate common audit findings into a concrete plan of attack. This table format is a great way to structure your blueprint for clarity and executive review.
| Identified Issue | Actionable Fix & SLA | Owner | Expected Outcome |
|---|---|---|---|
| MQLs go cold due to slow sales response (avg. 24 hrs). | Implement lead-to-account matching and round-robin routing with a 2-hour first-touch SLA. | Head of RevOps | +15% lift in MQL-to-SQO conversion rate within 60 days. |
| Sales team wastes 20% of time on manual data entry. | Deploy a sales engagement platform (e.g., Salesloft) to automate sequences and log activity in the CRM. | Head of Sales | +10% increase in rep-created pipeline per quarter. |
| Inaccurate forecasting; >20% variance from actuals. | Standardize deal stages and exit criteria in the CRM; implement mandatory weekly pipeline reviews. | Head of Sales | Reduce forecast variance to <10% within one quarter. |
| High churn (~25% annually) for SMB customer segment. | Create a dedicated onboarding playbook and automated check-ins for the first 90 days. | Head of Customer Success | Decrease first-year churn by 5 percentage points. |
This blueprint isn't just a to-do list; it’s a strategic document that outlines exactly how you’ll capture lost revenue.
Quantifying the Impact to Secure Buy-In
To get leadership on board, you have to speak their language: money. Your Revenue Growth Blueprint is incomplete until you attach an estimated dollar impact to each proposed fix. This single step transforms your plan from a cost center into a powerful revenue-generating initiative.
For instance, if your audit revealed that the average lead response time is 24 hours and you know industry benchmarks show that responding within the first hour can boost conversions by 7x, you can build a rock-solid business case.
Frame it like this: "By implementing a 2-hour SLA for all inbound leads, we estimate a 15% lift in our MQL-to-Opportunity conversion rate. Based on current volume, that translates to an estimated €250k in new pipeline next quarter alone."
Suddenly, you’re not just asking for resources to fix a leaky process. You’re presenting a clear, data-backed plan to generate more revenue, making it much easier to secure the budget and team alignment you need.
The Six-Week Implementation Sprint
Momentum is everything. A brilliant plan that sits on a shelf is worse than useless—it’s a waste of potential. To guarantee your blueprint gets immediate traction, structure the execution as a focused, six-week sprint.
Here’s a sample timeline to get you started:
- •Week 1: Finalize the blueprint, confirm all owners and SLAs, and hold a kickoff meeting with every stakeholder to get full alignment.
- •Week 2: Implement the top 1-2 "quick win" fixes. This usually involves process tweaks like updating lead routing rules or cleaning up critical CRM data fields.
- •Week 3: Start tracking the impact of your initial changes. Establish the new baseline metrics and hold a checkpoint meeting to review early progress.
- •Week 4: Tackle a more complex, system-level fix, such as optimizing a sales sequence or refining your MQL scoring model.
- •Week 5: Conduct hands-on training sessions with the sales and marketing teams on any new processes or tools to ensure everyone adopts the new way of working.
- •Week 6: Review the full six weeks of data. Present the initial results and measurable improvements to the leadership team, demonstrating the tangible ROI of the audit.
Once revenue leaks are diagnosed, a key part of your growth blueprint will involve actionable strategies to reduce customer acquisition cost by making your existing funnel far more efficient.
The scale of the opportunity here is massive, and the risk of doing nothing is just as significant. For companies in the €8–10M ARR range, an unaudited GTM strategy often means leaking 15-20% of potential revenue. Fixing that isn’t just an operational improvement; it’s a direct path to faster, more profitable growth.
Measuring Success and Establishing a Rhythm of Improvement
Your Revenue Growth Blueprint is live. Now what? This is where the real work begins—transforming the insights from your go-to-market audit into a durable, repeatable system for growth. It’s all about creating a rhythm of accountability that embeds a diagnostic mindset directly into your company’s DNA.
Let’s be honest: an audit's findings are perishable. Without a system to track progress and maintain momentum, teams inevitably drift back to their old habits. The very revenue leaks you just spent weeks plugging will slowly reappear. The goal now is to turn your one-time fix into a continuous engine for predictable growth.
Visualizing the Truth in Real-Time
First things first: forget about building another dense, multi-tab spreadsheet that gathers digital dust. The key is to create simple, brutally honest dashboards that track the handful of metrics you identified as critical in your audit. This isn't about reporting for the sake of it; it's about making the truth so visible that it’s impossible to ignore.
Your GTM dashboard needs to become the single source of truth for the entire revenue team, focusing on leading indicators that predict future success, not just lagging outcomes that tell you what already happened.
Here are a few charts that are non-negotiable:
- •Lead Response Time by Rep: A simple bar chart showing the average time each SDR takes for their first touch on a new lead. Nothing creates accountability around your new SLA faster than this.
- •Funnel Velocity by Cohort: A cohort chart is perfect for this. It tracks groups of leads created in a specific week or month, visualizing how quickly they move through each stage. You'll see immediately if your process changes are actually shortening the sales cycle.
- •MQL-to-SQO Conversion Rate Trend: A line graph tracking your Marketing Qualified Lead to Sales Qualified Opportunity conversion rate over time. This is the ultimate health metric for sales and marketing alignment.
These visuals don't just report data; they expose reality. They show what’s working, where friction remains, and who owns the outcome. For a deeper dive into dashboard design, our guide on effective KPI tracking offers a more detailed framework.
Establishing the Rhythm of Accountability
Data without dialogue is just noise. To keep your blueprint alive and breathing, you must establish a strict rhythm of review. This typically takes the form of a weekly or bi-weekly checkpoint meeting with key players from sales, marketing, and RevOps.
This meeting isn't a casual catch-up. It has a clear, non-negotiable agenda:
- •Review the Dashboard (10 mins): Look at the core metrics. Are we on track? Where are the red flags popping up?
- •Diagnose the Roadblocks (15 mins): Go owner by owner. What's preventing you from hitting your SLA or completing your action item? This isn't about assigning blame; it's about collaborative problem-solving.
- •Define Next Steps (5 mins): Get concrete commitments. Who is doing what, and by when? Document it and hold everyone to it.
"Modern GTM teams run complex revenue operations across multiple tools. Lead routing, matching, SLAs, and scoring are just a few of the processes that must work together. When something goes wrong, revenue is on the line."
This cadence creates a powerful feedback loop. It ensures that the insights from your go-to-market audit are constantly being acted upon, tested, and refined. It shifts your team from being passive observers of data into active drivers of performance.
Defining Success with Tangible Outcomes
Ultimately, the success of your audit isn’t measured by the number of issues you found, but by the tangible business outcomes you generate. Every single fix in your playbook needs a clear success metric tied directly to it.
You need to move away from vague goals and define victory in concrete terms:
- •Success looks like: Company X increased trial-to-paid conversion from 12% to 18% in 6 weeks.
- •Success looks like: Reducing our average sales cycle from 90 days to 75 days by the end of Q3.
- •Success looks like: Increasing our MQL-to-SQO conversion rate from 12% to 18% within the next 60 days.
This is how you build a high-performance culture. By turning your audit into a living system of measurement and accountability, you ensure that the path to predictable revenue isn’t just a one-time project—it's the new standard for how your business operates.
From Audit to Action: The Path to Predictable Revenue
Finishing your go-to-market audit isn't the finish line—it's the starting line. The real value isn't locked away in a diagnostic report; it's in turning those hard-won insights into decisive, measurable action. You've successfully moved past guesswork and can now operate from a place of data-driven truth.
For the first time, you have a clear, undeniable picture of what's happening inside your revenue engine. You know your funnel's real conversion rates, not the ones you hoped for. You can measure the actual length of your sales cycle in days, not just ballpark months.
Most importantly, you’ve pinpointed the precise bottlenecks that were silently killing your momentum.
The True ROI of Your Audit
The result isn’t just a healthier, more efficient pipeline. It's renewed confidence in your forecasting and strategic planning. When you know your numbers, you can set aggressive yet achievable targets. You can allocate resources with surgical precision, doubling down on what works and cutting what doesn’t.
This clarity eliminates the all-too-common friction between sales and marketing, finally aligning everyone around a single source of truth.
By systematically identifying and fixing these leaks, B2B scale-ups often uncover massive growth opportunities. Insights from Forrester show that even small improvements in funnel velocity compound into substantial revenue gains over time.
This isn't about a one-time fix. It’s about building a system—a rhythm of continuous improvement fueled by accurate data. Applying these principles creates a more resilient and predictable business. The outcome is clear.
Based on our experience helping SaaS and fintech companies implement these changes, you can expect to see a 15–25% improvement in your pipeline velocity in just six weeks. This is how you translate an audit into a direct impact on your bottom line.
Learn how the 6-Week Revenue Growth Sprint applies this framework to your business.
Answering the Tough Questions on GTM Audits
I get it. A full go to market audit sounds like a heavy lift. Founders and revenue leaders always have good, practical questions about what it takes, who needs to be involved, and whether it's truly worth the effort.
Here are the straight answers to the questions we hear most often.
How Often Should We Be Doing This?
For a B2B SaaS company floating in the €8–10M ARR range, a deep GTM audit should be a non-negotiable annual event. Think of it as a major physical for your revenue engine.
But that doesn't mean you can ignore it for the other 11 months. You need to supplement that deep dive with lighter, quarterly health checks on your core funnel metrics—things like conversion rates and sales cycle length. This is how you catch small issues before they blow up into quarter-killing problems.
What Tools Do We Actually Need for a GTM Audit?
You don't need to go out and buy a bunch of expensive new software. The real work happens by getting full, unfettered access to the systems you already use every day.
- •Your CRM (like HubSpot or Salesforce): This is your source of truth for all deal stages and sales activities.
- •Your Marketing Automation Platform (like Marketo): Where we find the raw data on lead creation and MQL timestamps.
- •Your Sales Engagement Tools (like Salesloft): This tells us what your reps are actually doing and how their sequences are performing.
Honestly, the most critical "tool" is a spreadsheet program like Google Sheets or Excel. This is about disciplined data extraction and analysis, not buying your way to an answer.
What's the Single Biggest Mistake We Could Make?
The most common—and costly—mistake is starting without a razor-sharp scope. So many teams try to boil the ocean. They set out to analyze every metric under the sun, which is a guaranteed recipe for analysis paralysis. The result is a 100-page report that just gathers digital dust.
A successful audit is ruthless in its focus. It zeroes in on the 5-7 core funnel metrics that actually move the revenue needle. Things like your lead-to-opportunity conversion rate, sales velocity, and lead response time will give you actionable insights, fast.
Realistically, How Long Does a Proper GTM Audit Take?
A comprehensive, data-driven go to market audit—the kind that delivers a real plan, not just observations—takes four to six weeks. This timeline isn't arbitrary; it ensures each phase gets the focus it needs to produce meaningful results.
- •Week 1: Data Gathering & Validation
- •Weeks 2-3: Analysis & Diagnosis
- •Week 4: Building the Revenue Growth Blueprint
Trying to rush this process almost always leads to superficial findings and fixes that don't stick. The whole point is to achieve depth and accuracy so you can drive lasting change across your entire revenue operation.
A thorough audit isn't an academic exercise; it's about gaining the clarity you need to build predictable growth. At Altior & Co., we specialize in uncovering the hidden revenue opportunities locked inside your GTM strategy.
Learn how our 6-Week Revenue Growth Sprint applies this exact framework to your business.