Pipeline Coverage: Stop guessing and start forecasting revenue. Learn to calculate ratios, diagnose risks, and build a reliable pipeline today.
Nothing keeps a revenue leader up at night like a missed forecast. It’s the ultimate nightmare scenario, and it’s why Pipeline Coverage is one of the most critical metrics in your arsenal. Think of it as your insurance policy against a bad quarter.
At its core, pipeline coverage measures the total value of your sales pipeline against your revenue goal. It’s a simple ratio that answers one crucial question: do you have enough qualified opportunities in the works to absorb the inevitable lost deals and still hit your number?
This guide provides a step-by-step framework to move beyond guesswork. You'll learn how to calculate an honest coverage ratio, diagnose the hidden risks in your pipeline, and implement a system for predictable revenue growth.
Why Your Gut Feeling About Pipeline Health Is Wrong
Unpredictable revenue is almost always a symptom of a much deeper problem: you’re flying blind. Too many leaders rely on a "gut feeling," looking at a big, top-line pipeline number and feeling a false sense of security. But that single number often hides a terrifying amount of risk.
Imagine your team has a €1 million quarterly quota and a pipeline valued at €3 million. On the surface, 3x coverage feels great. It feels safe. But what if 40% of those deals are stale, with no meaningful activity in over 30 days? According to a report from Salesforce, sales teams that don't rigorously manage their pipeline can see up to 50% of forecasted deals fail to close on time.
This is the gap between perception and reality that we at Altior uncover time and time again. A dashboard that looks healthy can easily mask the underlying rot that puts your entire quarter in jeopardy.

Businessman analyzing a 'REVENUE AT RISK' dashboard with various charts and data visualizations.
The Dangers of Inaccurate Coverage
When you rely on a simplistic or inflated pipeline coverage metric, you create a false sense of confidence that leads directly to disaster. The consequences aren’t just a missed number; they're severe, interconnected, and they ripple across the entire business.
Without a ruthlessly honest view of your coverage, you’re exposing the business to several critical risks:
- •Missed Forecasts and Quotas: This is the most obvious one. Insufficient pipeline is the number one cause of missed targets, forcing those stressful, end-of-quarter scrambles that burn everyone out.
- •Inefficient Resource Allocation: You end up pouring money into sales and marketing efforts that aren't actually generating enough qualified opportunities. Gartner research shows that companies with poor pipeline visibility often misallocate up to 30% of their sales budget.
- •Reactive and Scrambled Sales Motions: When coverage gets thin, reps are forced into "hero mode." They start offering deep discounts and pushing deals that aren't a good fit, which damages profitability and long-term customer relationships.
"I often see four common problems in companies that use pipeline coverage ratios... Hope rather than genuine customer intention or activity exaggerates funnel size." - Gary Smith, CEO, Gary Smith Partnership
This guide is your path out of that reactive cycle. We’ll show you exactly how to calculate your true pipeline coverage, diagnose the hidden weaknesses, and build a predictable revenue engine you can bet your job on.
How to Calculate Your Pipeline Coverage Ratio

A desk setup featuring a calculator, pen, and notebooks, with a blue banner displaying 'COVERAGE RATIO'.
Alright, you get the risk of flying blind. Now it’s time to ground your revenue strategy in real numbers. Calculating your pipeline coverage ratio is the first step toward predictable growth. Think of it as the diagnostic tool that tells you if you’ve got enough fuel in the tank for the journey ahead.
It’s a bit like packing for a long road trip. You wouldn’t just bring the exact amount of food and water you need; you'd pack extra for unexpected delays. Your sales pipeline is no different; your coverage ratio is that essential buffer.
The Basic Pipeline Coverage Formula
At its core, the formula is refreshingly simple. It’s a straightforward comparison between the total value of all your open opportunities and your sales quota for a specific period, usually a quarter.
Formula: Total Open Pipeline Value / Sales Quota = Pipeline Coverage Ratio
So, let's say your sales team has a quarterly quota of €1,000,000. If the total value of all open deals set to close in that quarter is €4,000,000, the math looks like this:
- •€4,000,000 (Pipeline Value) / €1,000,000 (Quota) = 4x Pipeline Coverage
This means for every euro you need to hit your target, you have four euros sitting in the pipeline. On the surface, 4x looks great. But this basic calculation can be dangerously misleading if you don't dig deeper. A Cloud Ratings report found a common gap where companies thought they had 3.6x coverage but actually needed 4.1x, proving that one simple number rarely tells the whole story.
Why Basic Coverage Is Not Enough
The problem with the simple formula is that it treats every single deal as equal, which we know is never true. A deal in the final negotiation stage with a 90% chance of closing is worlds apart from a newly qualified lead sitting at a 10% probability.
Relying only on that top-line number creates a false sense of security. It’s the reason so many leaders are blindsided when their "healthy" pipeline fails to deliver. This is precisely why top-performing RevOps teams use a weighted pipeline coverage calculation. This method multiplies each deal's value by its close probability (based on its sales stage), giving you a much more honest and realistic view of what you can actually expect to bring in.
What Does a Healthy Ratio Look Like?
So, what’s the magic number? While 3x has been the old-school rule of thumb, the truth is, "healthy" depends entirely on your business model, sales cycle length, and historical win rates.
Still, you need a starting point. The table below offers some generally accepted benchmarks to help you gauge your pipeline’s health at a glance.
Healthy Pipeline Coverage Ratios by Industry
Use these generally accepted benchmarks to gauge your pipeline's health against industry standards and identify potential risks.
| Pipeline Coverage Ratio | Pipeline Health Status | Common Scenario |
|---|---|---|
| 5x or Higher | Healthy & Well-Positioned | Your team has a strong buffer to absorb unexpected deal losses and is well-positioned for aggressive growth or over-performance. |
| 3x to 4x | On Target but Monitor | This is the standard healthy range for many SaaS companies. It indicates you have enough pipeline to hit your quota if win rates hold steady. |
| 2x to 2.9x | At-Risk | Your pipeline is thin. The team is under immense pressure to close nearly every deal, leaving no room for error or slipped opportunities. |
| Below 2x | Danger Zone | It is mathematically improbable that you will hit your quota. This signals an urgent need for pipeline generation activities. |
If your ratio is sitting in the "At-Risk" or "Danger Zone," don't panic. This number isn't a judgment—it's a diagnostic. It's the flashing light on your dashboard telling you where to look next. It’s the starting point for digging into the root causes of your pipeline gap, which is exactly what we'll tackle next.
Twelve Signs Your Pipeline Coverage Is in Trouble
Knowing your pipeline coverage ratio is step one. Step two is figuring out what that number is actually telling you. While a low ratio is an obvious red flag, even a seemingly healthy 4x coverage can hide serious issues that will put your entire quarter at risk.
It's a classic scenario: a sales leader reports 90% confidence in their forecast, but CRM data shows 40% of their pipeline hasn't had any real activity in the last 30 days. That’s the dangerous gap between perception and reality. This diagnostic checklist will help you spot the warning signs that it’s time to dig deeper.
1. Your Reps Are Always Scrambling at Quarter End
What it looks like: The last two weeks of the quarter are pure chaos—a flurry of "heroic" efforts, last-ditch discounts, and desperate calls to drag deals across the finish line.
What it really means: This isn't a sign of a scrappy, hard-working team. It's a clear symptom of not having enough early and mid-stage pipeline. When coverage is thin, reps are forced to rely on miracles instead of executing a predictable, well-paced sales motion.
2. Your Sales Cycle Length Is Creeping Up
What it looks like: Deals that used to close in 60 days are now stretching to 90, 120, or even longer.
What it really means: Stalled deals are pipeline poison. They just sit in your CRM, artificially inflating your coverage ratio while they slowly die on the vine. This points directly to bottlenecks in your sales process or reps who don't know how to create urgency.
3. "No Decision" Is Your Biggest Competitor
What it looks like: When you run a loss report, you see more deals dying from "no decision" than from losing to an actual competitor.
What it really means: Your value proposition isn't landing, or your team is spending time with prospects who never had the budget or authority to buy in the first place. These deals were never truly "in-pipeline," and they are destroying your forecast accuracy.
4. Your Forecast Is Riding on a Few "Whale" Deals
What it looks like: Your entire quarter hinges on landing one or two massive deals. If they slip, everyone misses their number.
What it really means: Your pipeline is fragile and lacks diversity. A healthy pipeline has a good mix of deal sizes. That way, losing one big opportunity stings, but it doesn't completely derail the quarter.
5. High Pipeline Value, Low Deal Activity
What it looks like: The total value of your open pipeline in the CRM looks great, but the "Last Activity Date" field tells a different story—a graveyard of stale opportunities.
What it really means: Your reps are suffering from "happy ears," failing to qualify deals out when they should. This creates a dangerously bloated pipeline that gives everyone a false sense of security until it’s far too late.
6. Marketing and Sales Are Pointing Fingers About Lead Quality
What it looks like: It's the classic feud. Sales claims the leads from marketing are junk. Marketing insists sales isn't working them properly.
What it really means: Your lead-to-opportunity conversion rate is probably in the gutter. This signals a fundamental misalignment on what a "qualified lead" even is, and that friction is a direct pipeline killer.
According to Gary Smith, CEO of the Gary Smith Partnership, a common problem is when "Hope rather than genuine customer intention or activity exaggerates funnel size." This is a classic symptom of poor sales and marketing alignment.
7. Discounting Is Your Default Closing Tool
What it looks like: Reps are consistently leaning on discounts to close deals, especially at the end of the month or quarter.
What it really means: A weak pipeline creates desperation. When reps don’t have enough other opportunities to feel confident about hitting their number, they start sacrificing margin to get anything over the line.
8. Your Win Rate Is Dropping
What it looks like: You're simply losing a higher percentage of qualified deals than you were six months ago.
What it really means: This is a strong indicator that your pipeline is full of poorly qualified, low-intent opportunities. When you feed low-quality deals into the top of the funnel, you inevitably get lower win rates at the bottom.
9. SDRs Are Busy but Not Booking Meetings
What it looks like: Your sales development team is hitting all their activity metrics—calls, emails, connections—but they just aren't setting enough qualified meetings.
What it really means: Your top-of-funnel motion is broken. The problem could be your Ideal Customer Profile (ICP), your messaging, or the channels you're using. Whatever the cause, it's starving your pipeline at its source.
10. You Have Low Stage-to-Stage Conversion Rates
What it looks like: You see a flood of deals entering the "Discovery" stage, but very few ever make it to "Demo" or "Proposal."
What it really means: You've got a major bottleneck in your sales process. Deals are stalling and dying before they gain any real momentum, which points to a failure in qualification, value communication, or both.
11. Your Pipeline Is Full of Last Quarter's Leftovers
What it looks like: A significant chunk of this quarter's pipeline consists of deals that were pushed from the previous quarter.
What it really means: A little slippage is normal, but too much points to systemic problems with qualification and forecasting. These "zombie deals" rarely close and give you a dangerously misleading coverage ratio.
12. You Have No Real-Time Visibility into Pipeline Creation
What it looks like: You know what your coverage is today, but you have no idea if you're generating enough new pipeline this month to hit your target next quarter.
What it really means: You're driving by looking in the rearview mirror. A mature RevOps function tracks pipeline creation as a leading indicator, ensuring you’re building tomorrow's revenue today, not just managing yesterday's opportunities.
The RevOps Playbook for Fixing Coverage Gaps
Okay, you’ve spotted the red flags in your pipeline. That's the first step. Now it’s time to move from diagnosis to a real plan of attack. Yelling “get more leads” at your team isn’t a strategy; it’s a symptom of a deeper problem. To fix this for good, you need a structured, repeatable system—a playbook that brings order to the chaos.
This isn't about simply working harder. It's about working smarter with a system that tells you the truth about what’s actually driving revenue and what’s just noise. A solid RevOps framework is the infrastructure for your entire revenue engine. Think of it like a gas pipeline. Without a well-built network to ensure consistent, reliable supply, delivery is impossible. Your sales pipeline is no different.
Our playbook is built on four core pillars that create a durable, high-performance revenue machine.
Pillar 1: Data and Systems Integrity
You can't fix what you can't see, and you can’t trust what you don’t measure. Clean, reliable data is the bedrock of any high-performing revenue team. It’s where your CRM becomes a single source of truth, not a collection of opinions and outdated notes.
This is where you enforce strict data hygiene and automate everything you can. Your goal is a system that surfaces reality, not just wishful thinking.
Concrete Tactics:
- •Implement a “No Activity, Stale Deal” Rule. This is non-negotiable. Automatically flag any opportunity that hasn’t had a logged call, email, or meeting in the last 21 days. It’s the single best way to stop reps from nursing zombie deals that artificially inflate your pipeline coverage.
- •Mandate Required Fields. Make fields like “Next Step” and “Next Step Date” mandatory before a deal can move to the next stage. This forces proactive thinking on every single opportunity.
Pillar 2: Process Optimization
Once your data is clean, you can start optimizing the actual processes that turn leads into cash. This is all about removing friction, especially at the handoff points between marketing and sales. Misalignment is the silent killer of pipeline coverage.
The classic symptom of a broken process? The endless blame game over lead quality. Sales claims the leads are junk; marketing insists sales isn’t following up fast enough. The data will settle the argument once and for all.
This is what a broken process feels like at a high level—it leads directly to that frantic, end-of-quarter scramble.
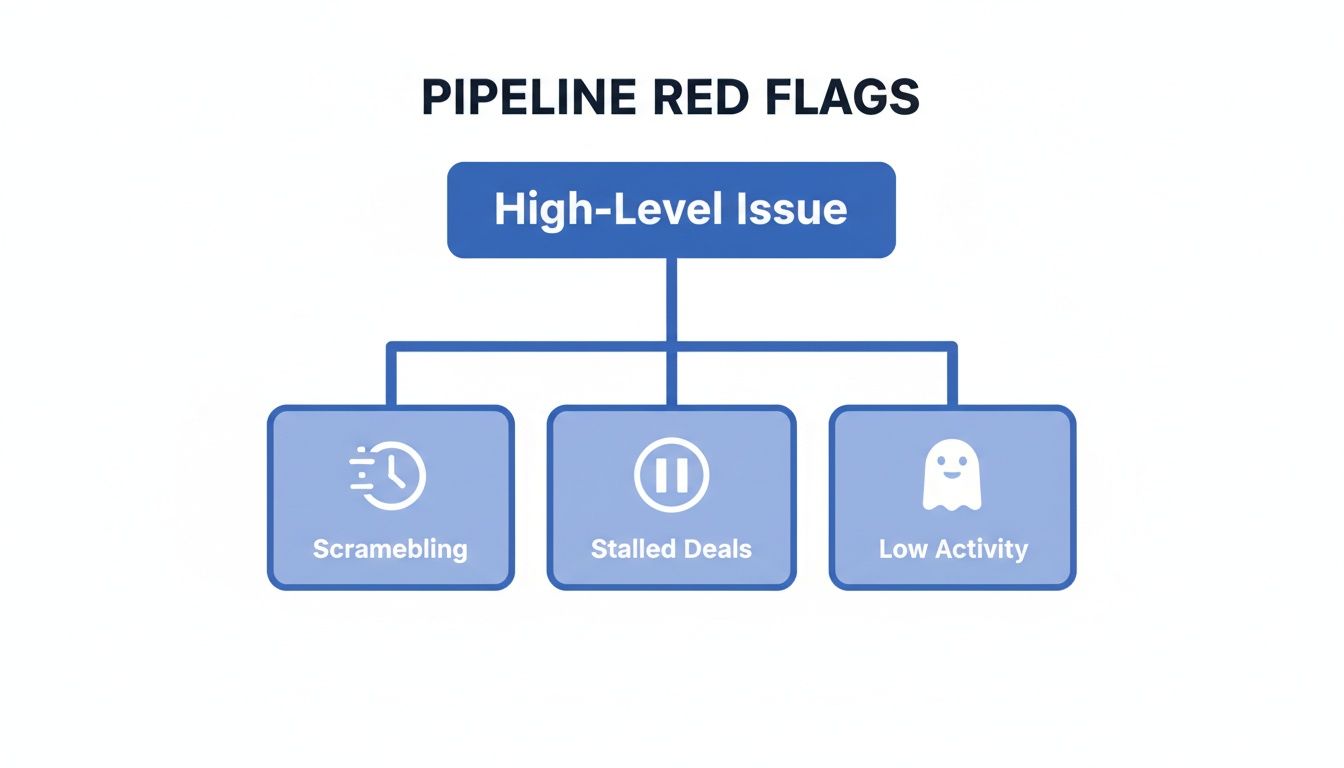
A flowchart titled 'Pipeline Red Flags' showing a 'High-Level Issue' leading to 'Scrambling', 'Stalled Deals', and 'Low Activity'.
As the visual shows, stalled deals and low activity are direct results of deeper process failures. Tactical fixes won't solve a systemic problem.
Concrete Tactics:
- •Establish a Service Level Agreement (SLA). Define the rules of engagement for lead handoffs. For example, marketing commits to delivering MQLs with a lead score over 80, and SDRs commit to a 2-hour maximum response time. No more ambiguity.
- •Standardize a Lead Disposition Process. Every single lead must be dispositioned by a rep (e.g., “Not a Fit,” “Bad Timing,” “Sent to Nurture”). This creates a critical feedback loop that helps marketing continuously refine its campaigns and targeting.
Pillar 3: Strategic Enablement
With clean data and aligned processes, it’s time to equip your reps to win more, faster. Strategic enablement isn't just handing them a new slide deck. It's about giving your team the specific content, tools, and training they need to crush objections and create urgency at every stage.
Your pipeline is telling you a story every single day. Strategic enablement is about giving your reps the language and tools to write a better ending for each chapter.
Concrete Tactics:
- •Build a “Deal Stall” Battlecard. Look at your data. Identify the top three reasons deals get stuck (e.g., “stuck in legal,” “champion went dark”). Then, create a one-page battlecard with specific email templates, talk tracks, and content to reignite momentum for each scenario.
- •Use AI for Call Coaching. Tools like Gong or Chorus are game-changers. They analyze sales calls to pinpoint exactly what your top performers are saying and doing differently. Use those insights to build data-backed training that elevates your entire team.
Pillar 4: Accurate Forecasting
This is the pillar that ties everything together. An accurate forecast isn't about predicting the future; it's about connecting effort to outcomes. When you can truly trust your forecast, you can make much smarter decisions about where to invest your team's time and resources.
This is how you move from a hope-based sales culture to a data-driven one. Your weekly forecast meeting transforms from a storytelling session into a strategic review based on reality. Of course, while building out this playbook, some businesses realize they need to quickly boost top-of-funnel activity and may look to partner with specialized lead generation outsourcing companies to fill immediate gaps.
Concrete Tactics:
- •Forecast by Weighted Pipeline. Ditch the gut-feel forecasts from your reps. Base your projections on the weighted value of your pipeline, which automatically accounts for the historical close probability of each sales stage.
- •Implement a 3-Question Bottleneck Framework. In every one-on-one, ask these three questions for each key deal:
- •What has changed since we last spoke?
- •What is the confirmed next step with the prospect?
- •What is our next internal action to move this forward?
This simple framework cuts through the noise and forces absolute clarity, helping you spot risk long before a deal slips. By putting this four-pillar playbook into action, you’re not just fixing today's pipeline gaps—you're building a system that prevents them from ever happening again.
A Six-Week Sprint to Predictable Revenue
Theory is great, but hitting your number is what actually matters. That RevOps playbook gives you the right framework, but you need a timeline to make it real. This is how we turn those strategic pillars into a tangible, high-impact sprint that delivers predictable revenue in just six weeks.

A whiteboard displays a '6-Week Sprint' plan with yellow sticky notes, alongside a coffee mug and a plant.
This sprint is designed to build momentum—fast. Each two-week block builds directly on the last, creating a system that gets smarter and stronger as you go.
Weeks 1-2: Pipeline Audit and Data Integrity Check
The first two weeks are all about establishing a single source of truth. You can't fix what you can't see, so the initial focus has to be on cleaning up your CRM data and setting the non-negotiable rules for pipeline management.
This phase is foundational. Without clean, reliable data, any process changes you make later will be built on sand. The goal is to transform your CRM from a messy notebook into a trusted, real-time diagnostic tool.
Success Criteria:
- •Data Accuracy: Hit 95% data accuracy in your CRM for all open opportunities. This means every deal has a correctly assigned stage, close date, and deal value.
- •Rule Implementation: Roll out an automated "stale deal" rule that flags any opportunity with zero logged activity in 21 days.
- •Field Mandates: Make the "Next Step" and "Next Step Date" fields mandatory for any stage progression.
Weeks 3-4: Implement Process and Automation Fixes
With clean data, you can finally start optimizing the engine itself. Weeks three and four are dedicated to fixing the broken handoffs and friction points that quietly kill deals and wreck your pipeline coverage. This is where you connect the systems and force the teams to align.
You'll use the truth from your new data to settle old arguments—especially the classic Sales vs. Marketing feud over lead quality. Automation becomes your best friend here, creating consistency and accountability that actually scales.
Success Criteria:
- •SLA Deployment: A formal Service Level Agreement (SLA) between marketing and sales is signed off and switched on. This has to include a maximum 2-hour lead response time for all MQLs.
- •Conversion Rate Improvement: See a 10% lift in your MQL-to-SQL conversion rate as a direct result of faster follow-up and clearer definitions.
- •Disposition Compliance: Achieve 100% compliance with your new lead disposition process, ensuring every single lead is correctly categorized to create a clean feedback loop.
Weeks 5-6: Optimize Sales Motions and Refine Forecasting
The final two weeks are all about equipping your team to win and connecting their effort directly to outcomes. You’ll arm your reps with data-driven enablement tools and refine your forecasting methodology until it's ruthlessly accurate.
This is where you see the cumulative effect of the sprint. Reps are more effective, managers are better coaches, and your leadership team can finally trust the numbers. For a deeper dive, check out our guide on how this sprint builds the foundation for more accurate revenue forecasting.
Success Criteria:
- •Enablement Adoption: Get 80% adoption of the new "Deal Stall" battlecards by the sales team.
- •Forecast Accuracy: Improve your forecast accuracy to within +/- 10% by shifting entirely to a weighted pipeline model.
- •Pipeline Velocity: Increase pipeline velocity by 15%, measured by a reduction in the average time deals spend stuck in key stages.
Case Study in Action: A B2B SaaS client, Company X, followed this exact six-week sprint. They were starting with a shaky 2.5x pipeline coverage and a sales team constantly scrambling. By the end of the sprint, they boosted their pipeline coverage ratio to a healthy 4x, which directly fueled a 20% lift in quota attainment the very next quarter.
Your Path to a Healthy and Predictable Pipeline
Pipeline coverage isn't just another RevOps metric to track on a dashboard. It’s your insurance policy against missed quotas—the very foundation of predictable growth.
Moving away from a reactive, hope-driven sales culture to a proactive, data-driven one is the goal. But a healthy pipeline absolutely depends on robust lead generation. Exploring modern strategies like AI-Powered Lead Generation is becoming essential for feeding the top of your funnel with high-quality opportunities.
When you get this right, the results are tangible and fast. Expect a 15–25% improvement in pipeline velocity within 6 weeks of implementing this framework.
Your pipeline is telling you a story every day. A solid RevOps framework helps you understand that story and write a better ending—one that finishes with hitting your number, quarter after quarter.
To get into the weeds on the day-to-day tactics that bring this to life, dig into our complete guide to strategic pipeline management.
Ready to stop guessing and start building? See how our 6-Week Revenue Growth Sprint can deliver these results for your business and build a truly predictable engine for growth.
Frequently Asked Questions About Pipeline Coverage
As a RevOps leader, you live and die by your pipeline coverage. Get it right, and you have predictable revenue. Get it wrong, and you're stuck in an endless cycle of end-of-quarter panic.
We get asked about this metric constantly. Here are the straight-up answers to the most common questions we hear from the trenches.
What Is a Good Pipeline Coverage Ratio for a SaaS Business?
For the vast majority of B2B SaaS companies, the healthy range for pipeline coverage is between 3x and 5x.
Think of 3x as the absolute floor. It gives you three euros in qualified pipeline for every one euro of your quota, leaving zero room for error. One or two deals slipping can derail your number.
A much safer—and more strategic—target is 4x to 5x coverage. This isn't just about having more pipeline; it's about building a buffer. This cushion absorbs the inevitable deal slippage and prevents your team from resorting to last-minute, margin-killing discounts just to hit their target. If you have a longer sales cycle or historically lower win rates, aiming for that 5x mark is just smart business.
How Often Should I Measure My Pipeline Coverage?
You need to be reviewing your pipeline coverage at least weekly. Full stop.
Treating this metric as a monthly or quarterly check-in is a recipe for disaster. By the time you spot a problem, it’s already too late to fix it for the current quarter. A weekly review cadence lets you catch negative trends early, giving you enough runway to take corrective action before a small gap becomes an insurmountable chasm in your forecast.
This number should be a cornerstone of your weekly sales meetings and every single one-on-one with your reps. When you monitor it constantly, pipeline coverage transforms from a lagging indicator of what already happened into a powerful leading indicator of future success.
What Is the Difference Between Pipeline Coverage and Pipeline Velocity?
It's easy to confuse them, but they measure two very different—though equally critical—aspects of your revenue engine's health.
- •Pipeline Coverage: This is all about volume. It measures the total value of your pipeline relative to your quota. It answers the question, "How much potential business do we have in the works?"
- •Pipeline Velocity: This is all about speed. It measures how fast deals are actually moving through your sales stages and turning into closed-won revenue. It answers the question, "How fast are we actually closing deals?"
You can have a massive 5x pipeline coverage ratio, but if your pipeline velocity is glacial and deals are just sitting there, you're still going to miss your target. One without the other creates a dangerous false sense of security. A truly healthy revenue engine needs both sufficient coverage and strong forward momentum.
Ready to stop reacting and start building a predictable revenue engine? Altior & Co.’s 6-Week Revenue Growth Sprint applies this framework to uncover and fix the hidden leaks in your pipeline, delivering measurable results fast.
Learn how the 6-Week Revenue Growth Sprint can build predictability into your business