Unlock predictable growth with our definitive guide to RevOps for B2B SaaS. Learn to fix revenue leaks, align teams, and implement a data-driven framework.
Revenue Operations isn't just another buzzword floating around your LinkedIn feed. It's the strategic discipline that fixes the silent, hidden gaps in your process that are actively draining your growth potential.
Think of it as the engineering function for your entire go-to-market engine. It’s what ensures Sales, Marketing, and Customer Success stop acting like separate departments and start working as one cohesive unit to drive predictable, efficient growth.
Your SaaS Is Leaking Revenue. Here's Why.

A mechanic in a blue uniform inspects a car's engine under an open hood, symbolizing a 'revenue leak'.
Let’s be honest. That nagging gap between what your sales leaders report in the board meeting and what your CRM data actually shows is a constant source of friction. Your company feels like a high-performance engine that's losing power, but you can’t quite put your finger on where the problem is.
That invisible issue has a name: revenue leakage. It’s the single most common challenge we see in B2B SaaS companies trying to scale past the €8M ARR mark. The money doesn't disappear in one big event; it seeps out through dozens of tiny, undetected cracks in your process—misaligned teams, slow lead handoffs, and broken systems that bleed your growth potential dry, day after day. For a deeper dive, check out our guide on how to spot revenue leakage.
The Perception vs. Reality Gap
At the heart of every revenue leak is a massive disconnect between perception and reality. It's the story you tell yourselves versus the story the data is telling you.
For example, a sales leader might confidently report that 80% of all marketing-qualified leads (MQLs) are followed up on within 24 hours. But when you actually dig into the system’s timestamps, the data reveals a brutal truth: only 25% of those leads ever get a real touch, and the average response time is creeping closer to 48 hours.
This isn't a "people problem"—it's a systems problem. Your team is working hard, but the process is failing them. Valuable leads are going cold in the CRM, marketing spend is being wasted, and your sales cycle is quietly extending, all while your dashboards paint a picture of a healthy funnel.
"Most B2B companies can grow—but few can do it predictably, efficiently, and in alignment across the entire go-to-market team. That’s the real risk: not missing a number once, but consistently falling short of predictable growth because the path wasn’t clear." – Dana Marxer, CEO of ayeQ
Where the Leaks Actually Happen
These leaks are rarely obvious. They're subtle and spread across the entire customer journey, typically happening at the handoff points between your teams. Without a unified operational strategy, you’re left with disconnected efforts that unintentionally sabotage growth.
The table below breaks down some of the most common disconnects we find when we start digging into a company's data. It’s where executive perception often collides with operational reality.
Perception vs. Reality: Common Revenue Leaks in SaaS
| Common Perception | Data-Driven Reality | Impact of the Leak |
|---|---|---|
| "Our sales team follows up on MQLs within a day." | CRM timestamps show the average lead response time is 42 hours, and 30% of MQLs never get contacted at all. | Hot leads go cold, marketing spend is wasted, and competitors get to your prospects first. |
| "Marketing is generating tons of great leads for us." | Sales reps mark 65% of marketing-generated leads as "low quality" or "unqualified" in the CRM. | Sales ignores marketing's pipeline, creating a cycle of blame and missed opportunities. |
| "Our pipeline coverage is healthy at 3.5x." | A deep dive reveals 40% of the pipeline is "stale"—deals with no activity in over 60 days. | Forecasts are wildly inaccurate, leading to poor resource allocation and missed quarters. |
| "Our sales process is consistent across the team." | Call recordings and CRM notes show reps using different messaging, pricing, and qualification criteria. | Inconsistent buyer experience, unpredictable win rates, and difficulty coaching the team. |
These scenarios highlight why a single source of truth is so critical. Without it, you’re flying blind, making strategic decisions based on assumptions rather than facts.
Here are a few more relatable examples of where revenue silently disappears:
- •Slow Lead Handoffs: A hot lead from marketing waits 36 hours for a sales rep to follow up. By then, they’ve lost all momentum and booked a demo with your competitor.
- •Inconsistent Data: Your CRM is a mess of incomplete or inaccurate data, making it impossible for your team to prioritize the best opportunities or personalize their outreach.
- •Lack of Sales and Marketing Alignment: Marketing celebrates hitting its MQL target, but sales complains the leads are low-quality. This creates a cycle of blame instead of a feedback loop for collaboration.
- •No Clear Ownership: When a process breaks down (like a lead routing rule), no one is sure who is responsible for fixing it. The problem persists for another quarter, leaking more revenue.
Each of these cracks seems small on its own, but together, they create a significant drag on your revenue engine. This guide will provide the blueprint to find those cracks and seal them for good.
What RevOps Actually Means for Your Business
Forget the buzzwords for a second. Revenue Operations isn't just another department you squeeze between sales and marketing. Think of it as the central nervous system for your entire go-to-market strategy—the operational backbone connecting every team, process, and piece of data to a single goal: predictable growth.
Instead of vague promises about “data-driven transformation,” effective RevOps for B2B SaaS is about building systems that prove what’s actually working. It unifies your Sales, Marketing, and Customer Success teams into a single, cohesive revenue engine, finally tearing down the silos that create friction and leak profit.
The Four Pillars of Revenue Operations
A solid RevOps function is built on four core pillars. When these elements work together, you get a clear, unfiltered view of your business performance. This is how you stop guessing and start making decisions based on truth.
- •People: This is all about creating cross-functional alignment. It ensures everyone, from an SDR to a CSM, is working from the same playbook, with shared goals and a clear line of sight into how their work impacts the entire customer lifecycle.
- •Process: This involves mapping and optimizing every single step of your customer's journey. It’s about answering questions like, "What's the exact handoff from Marketing to Sales?" or "What's our SLA for responding to a high-intent lead?"
- •Platforms: This pillar focuses on your tech stack—your CRM, marketing automation, and analytics tools. The goal isn’t to have more tools, but to integrate them into a seamless system that provides a single source of truth.
- •Data: This is the absolute foundation. It’s about ensuring the information flowing through your systems is clean, accurate, and accessible, allowing you to reliably measure what matters most.
"Revenue Operations is the discipline of designing, instrumenting and iterating your company’s go-to-market engine to provide a better customer experience and, as a result, maximise revenue." - Forrester
This shift towards a unified, data-centric approach isn't a choice anymore—it's a necessity. The Asia Pacific RevOps market, for example, is expected to see the fastest growth rate globally, a trend fueled by rapid digital transformation and cloud adoption. This regional acceleration reflects a fundamental change in how SaaS companies think about growth, moving away from a "growth at all costs" mentality toward investor demands for efficient, durable revenue. Discover more insights about this SaaS trend and others from Vena Solutions.
From Theory to Practical Answers
A well-oiled RevOps function doesn’t just spit out reports; it provides concrete answers to the critical questions that keep founders and CEOs up at night. It's the difference between hoping you'll hit your number and knowing precisely what levers to pull to make it happen. You can get an in-depth explanation of the core principles by exploring our definition of Revenue Operations.
With a proper framework in place, you can finally answer questions like:
- •How long does it really take to convert a trial user into a paying customer?
- •What is our true, uninflated pipeline coverage for next quarter?
- •Which marketing channels are producing leads that actually close?
By answering these, you move from managing chaos to orchestrating growth.
The Five Critical RevOps Metrics You Must Track
Moving from theory to action means zeroing in on the vital signs of your revenue health. Just like a doctor checks your blood pressure and heart rate, a RevOps leader diagnoses the health of a B2B SaaS business by monitoring a core set of metrics. These aren't vanity numbers; they're the indicators that pinpoint exactly where your revenue engine is leaking.
Tracking these five fundamental metrics gives you an unfiltered view of what's actually happening in your funnel. It replaces gut-feel assumptions with hard data, giving you immediate, actionable insights to apply to your own operations.
1. Conversion Rates
This is the most basic yet most powerful diagnostic tool you have. It measures the percentage of leads or deals that successfully move from one stage of your funnel to the next. Forget about a single "funnel conversion rate"—that's a vanity metric. You need to track the micro-conversions at each critical handoff point, like MQL-to-SQL, SQL-to-Demo, and Demo-to-Closed-Won.
For a scaling SaaS, this is your efficiency score. Low conversion rates between stages are the clearest possible signal of a process breakdown, poor lead quality, or a complete messaging mismatch. To get this right, having a solid grasp on understanding marketing attribution is non-negotiable, as it tells you which efforts are actually driving the needle.
Real-World Example: We worked with a SaaS company stuck with a dismal 15% MQL-to-SQL conversion rate. Sales was drowning in low-quality leads. By tightening the MQL definition and implementing automated lead scoring, they pushed that rate to 28%, ensuring reps only spent their valuable time on prospects who were actually ready to talk.
2. Pipeline Coverage
Pipeline coverage is simply the ratio of your open pipeline value to your sales quota for a given period. The old rule of thumb was a comfortable 3x. In today's market? That’s dangerously thin. For a B2B SaaS company in the €8-10M ARR range, a healthy ratio is often closer to 4x or even 5x, depending on your specific win rates and sales cycle.
Think of this metric as your insurance policy against missing the quarter. If your coverage is weak, it’s a flashing red light that your marketing and sales development teams aren't generating enough qualified opportunities to feed the sales team's quota.
This visual from SaaStr perfectly illustrates why the "3x" rule is often too simplistic. True coverage needs are unique to your business model and sales efficiency. Benchmarks are a starting point, not a universal law.
3. Lead Response Time
This one is brutally simple: how long does it take for a sales rep to follow up with an inbound lead once it hits their queue? In B2B SaaS, speed isn't just a virtue; it's everything. A lead's intent is never higher than in the moments after they hit "submit" on your demo request form.
Slow response times are a direct, self-inflicted revenue wound. A well-known study from LeadResponseManagement.org found that the odds of qualifying a lead drop by a staggering 10 times in the first hour. If your response time is measured in days, you might as well just forward those leads directly to your competitors.
A fintech SaaS we worked with discovered their average lead response time was a painful 24 hours. By implementing an automated round-robin routing system and a strict 2-hour SLA, they boosted their MQL-to-SQL conversion by an incredible 18% in just one quarter.
4. Sales Cycle Length
This metric tracks the average time it takes to get from the very first touchpoint with a prospect to a closed-won deal. A long or, even worse, a lengthening sales cycle is a massive red flag. It points to friction in your sales process, ineffective qualification, or a fundamental failure to communicate your value.
For any scaling SaaS, shortening the sales cycle is one of the fastest ways to accelerate revenue growth without spending another dime on marketing. This is where RevOps shines—identifying the bottlenecks, like deals getting stuck in the proposal stage for weeks, and implementing process fixes to improve sales velocity.
5. Follow-Up Rates
This is where perception and reality often have a painful collision. Leadership believes every lead is being worked diligently, but the data often tells a completely different story. The follow-up rate measures the percentage of leads that actually receive a predefined number of touches (e.g., 5-7 emails and calls) before being disqualified.
Inconsistent follow-up is pure, unadulterated revenue leakage. A HubSpot report famously found that 80% of sales require at least five follow-up calls, yet a shocking 44% of salespeople give up after just one. Implementing a structured, automated follow-up cadence in your CRM is one of the simplest yet highest-impact RevOps fixes you can make. It ensures no lead gets left behind.
For a deeper dive into setting up these systems, check out our complete guide to KPI tracking, which explains how to put these metrics into a cohesive system.
To tie this all together, here’s a quick reference table with some key metrics and benchmarks to help you gauge the health of your own revenue operations.
RevOps Health Check Key Metrics and SaaS Benchmarks
| Metric | What It Measures | Target Benchmark (€8-10M ARR) | Why It Matters |
|---|---|---|---|
| MQL-to-SQL Conversion | Percentage of marketing-qualified leads accepted by sales. | 25% - 40% | Indicates lead quality and marketing-sales alignment. Low rates mean wasted marketing spend. |
| SQL-to-Close Rate | Percentage of sales-qualified leads that become customers. | 20% - 30% | Measures sales team effectiveness and process efficiency. |
| Pipeline Coverage | Ratio of open pipeline value to sales quota. | 4x - 5x | Your buffer against missing revenue targets. Too low signals a future pipeline gap. |
| Lead Response Time | Average time to first contact with an inbound lead. | < 15 Minutes | Directly impacts conversion rates. Speed is critical to capitalizing on prospect intent. |
| Sales Cycle Length | Average time from first contact to closed deal. | 60 - 90 Days | A key indicator of sales velocity. Shorter cycles accelerate cash flow and growth. |
| Follow-Up Rate | % of leads receiving the full, defined follow-up cadence. | > 95% | Ensures you're maximizing the value of every lead generated. Prevents "lead leakage." |
These benchmarks provide a solid starting point for any B2B SaaS company around the €8-10M ARR mark. If your numbers are falling short, you've just found the first place your RevOps team needs to dig in.
Your Six-Week Blueprint for Implementing RevOps
Theory is a great start, but real progress comes from a clear, time-bound plan. This is where the rubber meets the road. We'll walk you through a practical six-week sprint that makes implementing RevOps for B2B SaaS feel achievable, breaking down a complex transformation into manageable weekly goals.
This isn’t about boiling the ocean. It’s about making targeted, high-impact fixes that deliver measurable results—fast. This blueprint is designed to build momentum, secure early wins, and lay a solid foundation you can build on for months to come.
Weeks 1-2: Audit and Map Your Current Reality
Your first two weeks are dedicated to one thing: achieving radical clarity. You cannot fix what you cannot see. The objective is to move away from assumptions and map the entire lead-to-revenue journey exactly as it exists today, not as you wish it were.
During this diagnostic phase, your goal is to answer a few critical questions about your sales and marketing process:
- •What is the precise path a lead takes? Map every single touchpoint, system handoff, and human interaction from the moment a lead enters your world to the second they become a customer.
- •How long does each stage really take? Ditch the anecdotal evidence. Use CRM timestamps to measure the time between key stages, like an MQL being created and the first sales contact being made.
- •Where does data quality break down? Hunt for the fields that are consistently missing, incorrect, or outdated. Remember, poor data is the root cause of most revenue leaks.
By the end of Week 2, you should have a visual process map and a baseline report of your core metrics—lead response time, stage-by-stage conversion rates, and sales cycle length. This document is your "before" picture, the single source of truth that will guide every decision you make next.
Weeks 3-4: Identify Leaks and Build the Roadmap
With your current state clearly mapped, the revenue leaks will start to become painfully obvious. You’ll see that 36-hour delay between a marketing handoff and a sales touch. You’ll notice the pile of "stale" deals that haven't been touched in 60 days. This is your focus for weeks three and four: prioritizing these leaks and building an actionable roadmap.
Your task is to create a prioritized list of fixes based on two simple factors: impact and effort. A fix that is high-impact and low-effort (like implementing an automated lead routing rule) should jump straight to the top of your list.
For each problem you've identified, create a clear action plan that includes:
- •A specific fix: "Implement round-robin lead routing for all demo requests."
- •A clear owner: "Sarah, Sales Ops Manager."
- •A defined SLA: "All inbound demo requests must have a first touch within 2 hours."
- •A success metric: "Reduce average lead response time from 28 hours to <2 hours."
This roadmap transforms vague problems into concrete projects with real accountability. For a deeper look at how this impacts team cohesion, explore our guide on achieving true sales and marketing revenue alignment.
This timeline illustrates how tracking core RevOps metrics like response time, sales cycle, and conversion rates provides a clear picture of your operational health over time.
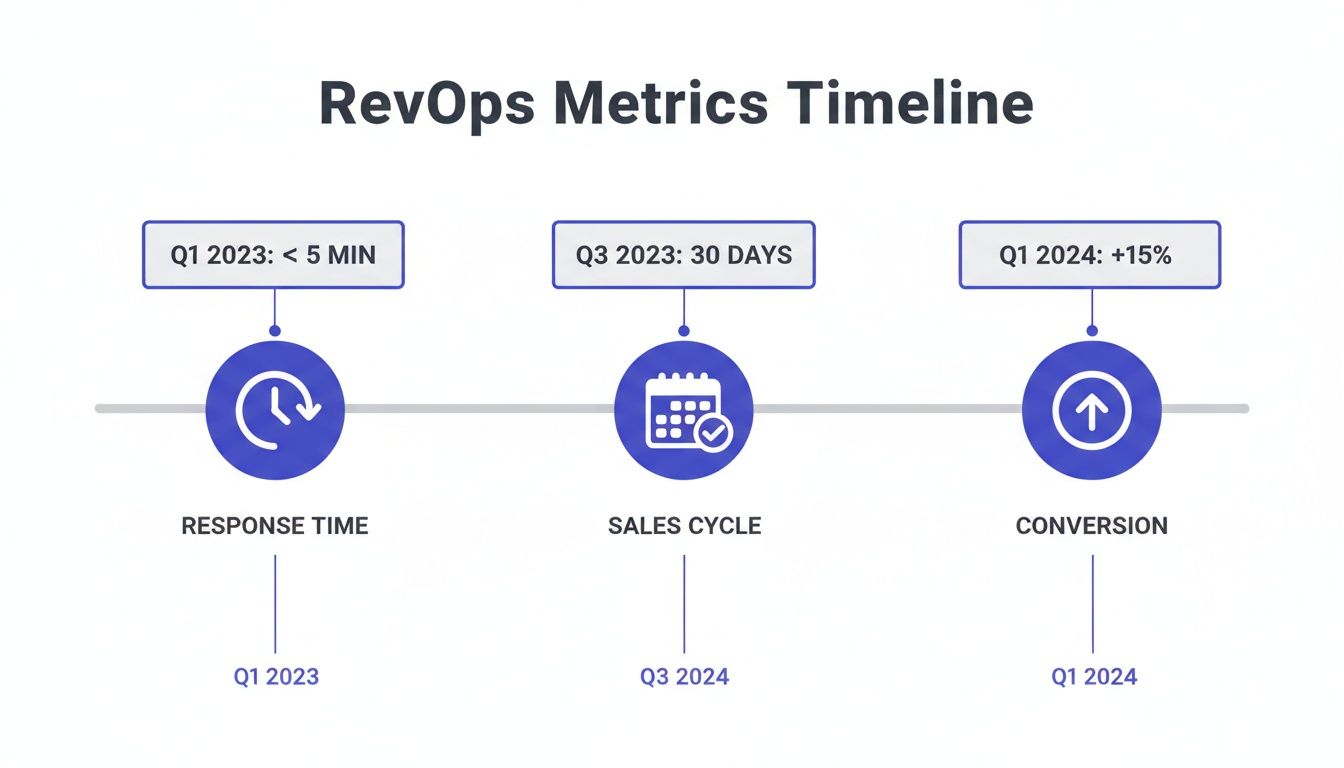
RevOps metrics timeline illustrating targets for response time, sales cycle, and conversion across different quarters.
Weeks 5-6: Implement Fixes and Build Your Dashboard
The final two weeks are all about execution and measurement. This is when you implement the highest-priority fixes from your roadmap and build the tools to track their impact. This is where you start to see tangible results.
Your focus should be on "quick wins" that can be implemented without a massive, months-long overhaul. This could be things like:
- •Activating CRM automation to create follow-up tasks for your reps.
- •Cleaning up your lead status and deal stage picklists to ensure consistency.
- •Creating a simple, automated report for lead response times.
As you get into the implementation journey, leveraging the right automation is key. Explore how the best AI workflow automation tools can help you streamline these processes and eliminate soul-crushing manual work.
Finally, build your foundational RevOps dashboard. This shouldn't be a complex beast with dozens of charts. Start with the five critical metrics we've been talking about: conversion rates, pipeline coverage, lead response time, sales cycle length, and follow-up rates. This dashboard becomes your ongoing health monitor, allowing you to see the impact of your changes in near real-time and prove the ROI of your efforts.
Unifying Your Tech Stack for a Single Source of Truth

A laptop displays 'SINGLE SOURCE' with a diagram of interconnected business icons on a wooden desk.
A RevOps for B2B SaaS strategy is only as strong as its technology foundation. But for most scaling companies, the tech stack is a jumble of disconnected tools—a CRM that doesn't talk to marketing automation, analytics platforms spitting out different numbers, and a billing system that lives on its own island.
This fragmentation is the root cause of data silos. It creates a fractured, incomplete picture of the customer journey that makes real visibility impossible. When your systems don't communicate, you can't trust your data, forcing your teams to make critical decisions based on gut feelings or messy, error-prone spreadsheets.
Architecting Your Single Source of Truth
Building a single source of truth isn't about buying more software. It’s about making the tools you already have work together as a cohesive unit. The goal is to create an integrated ecosystem where data flows seamlessly from one platform to another, giving everyone one clean, reliable view of all revenue-related activities.
This becomes absolutely critical when you're targeting complex markets. Think about B2B SaaS firms at the €8–10M ARR stage expanding into APAC. Success here means designing flexible pricing that works for massive enterprises in Sydney and nimble SMEs in Jakarta. This kind of pricing agility demands a sophisticated RevOps infrastructure that most teams simply can't execute reliably on their own. Read the full research about B2B SaaS market trends.
A well-architected stack should support your growth, not get in its way.
Practical Integration: HubSpot and Salesforce
One of the most common and high-impact integration points is between your marketing automation platform (like HubSpot) and your CRM (like Salesforce). When this connection is seamless, lead data, behavioral insights, and campaign history are instantly available to your sales team the moment a lead is assigned.
This simple fix eliminates the dreaded "black hole" where MQLs go to die. It gives reps the context they need to have meaningful conversations from the very first call. A proper integration enables bidirectional data syncs, automated lead routing, and closed-loop reporting that shows you exactly which marketing activities are actually driving revenue.
Here’s a common view of how HubSpot and Salesforce can be configured to sync objects, keeping data consistent across both platforms.
A laptop displays 'SINGLE SOURCE' with a diagram of interconnected business icons on a wooden desk.
The key takeaway? Granular field mapping is everything. Just connecting the tools isn’t enough; you must define exactly how specific data points (like lead status or MQL source) translate between systems. This is the only way to maintain a single, reliable truth.
The Role of AI in a Modern Tech Stack
Beyond basic integrations, AI-powered tools are now essential for maintaining the health of your revenue database. They don't just add more noise; they amplify the truth by automating the tedious, manual tasks that lead to data decay over time.
AI and automation can help you:
- •Automate Data Entry: Tools can automatically capture contact information from emails and calendars, slashing manual errors and saving reps hours of valuable time each week.
- •Improve CRM Hygiene: AI can identify and merge duplicate records, standardize data formats, and flag incomplete profiles, ensuring your database stays clean and trustworthy.
- •Enrich Lead Data: Automation can pull in firmographic and technographic data from third-party sources, giving your team a much richer understanding of every single prospect.
By building an integrated and automated tech stack, you create a foundation that provides a clear, accurate, and real-time view of your entire revenue engine.
Putting RevOps Into Action: A Growth Case Study
Theory and metrics are great, but the real magic of **RevOps for B2B SaaS** happens when you see the results firsthand. Let's walk through a real-world example of how this unified approach can take a struggling revenue engine and turn it into a high-performance growth machine.This story is about a B2B SaaS company, a leader in the logistics space, that hit a wall right around the €9M ARR mark. They had a great product and a talented team, but their growth had stalled, and their revenue forecasts were becoming less of a science and more of a wild guess.
The Diagnosis: Stagnation and Uncertainty
When we kicked off our 6-Week Revenue Growth Sprint, the initial diagnostic phase revealed a painful truth: the leadership's perception of their go-to-market process was dangerously out of sync with reality. They thought things were working. The data told a completely different story.
We quickly uncovered two critical revenue leaks that were silently bleeding their growth momentum dry:
- •An alarming 48-hour average lead response time. Red-hot inbound leads, often from their most expensive marketing campaigns, were just sitting in the CRM for two full days before a sales rep even looked at them.
- •A bloated 85-day average sales cycle. Deals were getting stuck in the middle of the funnel with no clear next steps. This created a stagnant, clogged pipeline that made accurate forecasting impossible.
The Fix: Targeted Action and Clear Accountability
With the data telling us exactly where the problems were, we didn't propose some massive, year-long overhaul. Instead, we focused on high-impact fixes that directly addressed the biggest leaks, just like the blueprint we’ve outlined. It was a targeted, two-pronged attack.
- •For Lead Response Time: We implemented a simple, automated, round-robin lead routing system right inside their existing CRM. More importantly, this was paired with a strict 2-hour SLA for all new inbound leads, creating immediate accountability.
- •For Sales Cycle Length: We worked with sales leadership to tighten up their process, specifically by adding stricter qualification criteria at the discovery stage. This gave reps the power to disqualify poor-fit leads much earlier, freeing them up to focus their energy on deals that could actually close.
These weren't just tweaks to a workflow; they were a fundamental shift in how the team operated. We replaced ambiguity and guesswork with clear, data-backed rules of engagement—a system built for speed and efficiency.
The Outcome: Measurable Growth and Renewed Momentum
The results came fast, and they were significant. This wasn't about some vanity metric getting a slight bump. It was about creating a real, measurable impact that went straight to the bottom line.
Within just six weeks of implementing these initial changes, the company saw:
- •A 29% reduction in their sales cycle, dropping it from a painful 85 days down to 60 days.
- •A 50% increase in their trial-to-paid conversion rate, which jumped from a respectable 12% to an impressive 18%.
This powerful combination of speed and efficiency unlocked an estimated €500k in new ARR, putting the company squarely back on its growth path. This is a perfect example of how a focused, data-driven RevOps approach makes growth not just possible, but predictable. Expect 15–25% improvement in pipeline velocity within 6 weeks.
RevOps FAQs: Your Questions Answered
When founders and revenue leaders start exploring RevOps, a few key questions always come up. Let's tackle them head-on, cutting through the jargon to give you the clarity you need.
When is the Right Time to Formalize RevOps?
While RevOps principles help at any stage, the alarm bells really start ringing around the €5M-€10M ARR mark.
This is the point where the go-to-market playbook that got you here starts to fray at the edges. Complexity skyrockets, your customer data gets trapped in different tools, and growth starts to feel unpredictable.
Implementing a structured RevOps for B2B SaaS framework at this stage isn't a luxury; it's a proactive move. It’s about building the engine for your next phase of growth before the old one breaks down on the side of the road.
Isn't RevOps Just a Fancy New Name for Sales Ops?
No, and confusing the two is a critical mistake. Sales Ops traditionally lives inside the sales department. Its job is to make the sales team more efficient—think territory planning, CRM workflows, and comp plans. Its focus is entirely on the sales silo.
RevOps has a much, much bigger job. It owns the entire customer journey, from the first marketing click all the way through to sales, customer onboarding, and renewal. It connects all the dots.
The core mission of RevOps is to engineer a seamless, data-driven customer experience by aligning Marketing, Sales, and Customer Success. Sales Ops, by its very definition, simply isn’t equipped to see that whole picture.
Who Should My First RevOps Hire Be?
For a company crossing that €8-10M ARR threshold, you need a specific kind of person. Your ideal first hire is often a "RevOps Generalist" or a "Director of Revenue Operations."
This isn't just a Salesforce admin or a marketing automation guru. The person you hire must be a hybrid—deeply analytical, obsessed with process, and fluent in technology. They are strategic operators who can see exactly how a broken process or a messy CRM is costing you revenue.
Another powerful route is to bring in an external expert for a focused project, like a 6-week sprint. This gives you an immediate diagnostic of your revenue engine and a prioritized roadmap without the long-term commitment of a full-time hire. You get the expertise and a clear path forward, right when you need it most.
Ready to stop guessing and start building a predictable revenue engine? Learn how the 6-Week Revenue Growth Sprint applies this framework to your business, uncovering hidden leaks and providing a clear blueprint for scalable growth. Learn how we can help you accelerate your path to predictable revenue.