Unlock revenue growth with our RevOps guide to conversion optimization. Learn to diagnose funnel leaks, run impactful A/B tests, and automate processes.
Conversion optimization is the systematic process of increasing the percentage of users who take a desired action—signing up, booking a demo, or buying your product. It’s not about guesswork. It’s a data-driven discipline focused on understanding how users actually move through your funnel and removing the friction that stops them cold.
The goal isn't just to tweak your website; it's to build a revenue engine that shows you what’s actually working, so you can turn more traffic into predictable growth.
Why Your Funnel Leaks Revenue and How to Find the Holes
Are you spending heavily on marketing only to see leads vanish somewhere between a click and a closed deal? This isn't just a marketing problem; it's a systemic revenue operations failure. Hidden friction points across the customer journey are silently draining your profitability.
The hard truth is that most companies don’t realize how broken their process is. A foundational HubSpot study revealed a massive perception gap: 80% of businesses believe they provide a "superior" customer experience, but only 8% of their customers agree. That 72% gap is where your revenue disappears.
Moving Beyond Surface-Level Metrics
Your analytics might show healthy traffic, but that's a vanity metric if your trial-to-paid conversion rate has been stuck at 2% for six months. Real conversion optimization starts when you treat your funnel like a pipeline with potential leaks at every connection.
To find those leaks, you have to ask much sharper questions:
- •Acquisition to Activation: What percentage of people who see your pricing page start a trial? A major drop-off might not be the price itself but a confusing value proposition.
- •Activation to Engagement: Of all trial users, how many complete critical onboarding steps? A steep decline often points to a confusing UI or a failure to demonstrate your product's "aha!" moment quickly enough.
- •Engagement to Conversion: How many active trial users convert to paid? If this number is low, the issue could be anything from a broken sales handoff to a complex pricing model.
"Every conversion point is a promise. When a user clicks, they expect a seamless transition. A slow page, a confusing form, or an irrelevant offer breaks that promise and erodes trust—and with it, your revenue." — Brian Balfour, Founder/CEO at Reforge
Diagnosing these problems demands a methodical approach. Stop randomly testing button colors and start focusing on the segments with the biggest drop-offs.
For example, many sales leaders report 90% follow-up compliance on MQLs, but a deep dive into CRM data often reveals the reality is closer to 25%. That isn’t a website issue; it’s a critical process and data integrity leak. This is the core of a RevOps-led approach. It’s about systematically identifying the real sources of revenue leakage across your systems. When AI-powered analytics reveal what's actually happening, you can stop guessing and start patching the holes.
To get you started, here's a quick framework for spotting common culprits.
Common Revenue Leaks and Their First-Step Fixes
Use this diagnostic tool to pinpoint conversion bottlenecks and identify immediate, actionable steps.
| Funnel Stage | Common Leak (Symptom) | Diagnostic Question | First-Step Fix |
|---|---|---|---|
| Top of Funnel (Awareness) | High traffic, low MQLs | Is our website copy speaking to the right pain points? | Run a 5-second test on your homepage to see if visitors understand your value proposition. |
| Middle of Funnel (Consideration) | High MQLs, low SQLs | Is our lead scoring model accurately identifying sales-ready intent? | Audit your lead scoring criteria; remove points for low-intent actions like social media follows. |
| Bottom of Funnel (Decision) | High number of demos, low close rate | Are sales reps consistently following up after a demo? | Implement an automated follow-up sequence in your CRM triggered 24 hours after a demo is completed. |
| Post-Purchase (Retention) | High first-month churn | Is our onboarding process effectively guiding users to value? | Set up a product analytics event to track completion of the first key "activation" task. |
Think of these as the first threads to pull. Once you identify a leak, you can dig deeper to design a more robust, long-term fix.
Building a Conversion Dashboard That Matters
You can't fix what you can't see. A dashboard cluttered with vanity metrics is like trying to diagnose an engine problem by admiring the paint job—it tells you nothing about the health of your revenue engine.
An effective conversion optimization strategy lives and dies by its dashboard. It’s about tracking the KPIs that directly map to pipeline growth. Anything else is just noise.
This focus is critical in hyper-growth markets. For instance, the Middle East and Africa e-commerce space is projected to rocket from USD 155.16 billion in 2025 to USD 302.43 billion by 2030. With over 72% of B2C transactions on smartphones, you need a laser-focused view to turn clicks into predictable revenue.
From Vanity Metrics to Revenue KPIs
Your conversion dashboard needs to tell one story: how does an anonymous visitor become a paying customer? Forget vague metrics and zero in on the critical handoff points where value is either created or destroyed.
Start by mapping these core conversion rates:
- •Lead-to-Opportunity Rate: What percentage of qualified leads does sales accept and turn into a real pipeline opportunity? A low number signals a serious disconnect between marketing's definition of "qualified" and what sales actually needs.
- •MQL-to-SQL Conversion: How efficiently do Marketing Qualified Leads become Sales Qualified Leads? This is a direct measure of your sales and marketing alignment.
- •Trial-to-Paid Conversion: For product-led companies, this is the moment of truth. What percentage of trial users become paying customers? A B2B SaaS company we worked with used this metric to discover an onboarding bottleneck, increasing trial-to-paid conversion from 12% to 18% in just six weeks.
A great dashboard doesn't just show you what broke; it shows you where it broke. It pinpoints the exact stage of the funnel that’s leaking so you can apply resources with surgical precision.
This is the core of our three-step diagnostic process: identify the symptom, diagnose the cause, and then fix the leak.
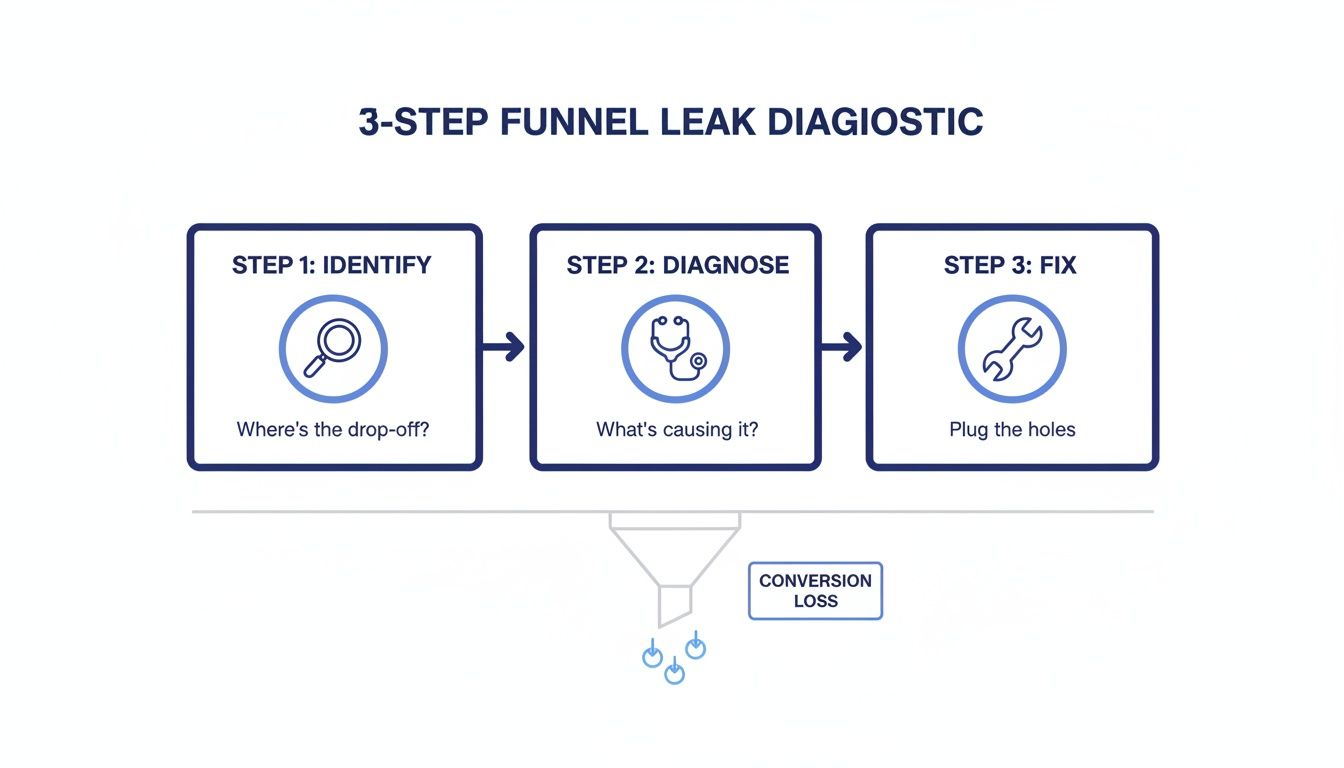
A diagram illustrating a 3-step funnel leak diagnostic process: identify, diagnose, and fix conversion loss.
This simple flow moves you from reacting to problems to proactively managing your funnel's health.
Setting Benchmarks That Drive Action
Once you've locked in your KPIs, you need realistic benchmarks. A good benchmark is grounded in industry standards and your own historical performance.
For instance, a 2% MQL-to-SQL conversion rate might sound low, but if your historical average is 1.2%, then hitting 2% is a massive win.
Look at industry data for a gut check. RevOps platforms like HubSpot and Salesforce report that healthy B2B SaaS companies often see Lead-to-Opportunity rates between 10% and 15%. If your dashboard shows you're stuck at 4%, you've just found your top priority for the quarter.
Ensure these KPIs live in your CRM, whether it's HubSpot or Salesforce, to create a single source of truth. A well-built dashboard should allow anyone on the revenue team to understand performance in under 30 seconds. For a deeper dive, check out our guide on essential revenue analytics.
Ultimately, your dashboard has one job: to spark faster, smarter decisions. It should change the conversation from, "I think we have a problem with our leads," to "Our Lead-to-Opportunity rate dropped 20% last month. Let's isolate the MQLs from the webinar campaign and find out why." That’s the shift to data-driven action that powers growth.
Running Experiments That Actually Drive Decisions
Effective conversion optimization isn’t about chasing gut feelings. It's a disciplined, scientific process. Without a structured approach, you’re not optimizing; you’re just making changes and hoping for the best.

Person's hands typing on a laptop and holding a pen near a notebook, with a 'TEST & LEARN' banner.
Many teams stumble here. They run tests without a clear purpose or declare a winner too soon. The goal isn't just to find a "winner"; it's to generate a learning that makes your entire revenue engine smarter.
From Vague Idea to Testable Hypothesis
Every meaningful experiment starts with a strong, falsifiable hypothesis. A weak one is a guess, like "a new headline might work better." A strong hypothesis is a clear, cause-and-effect statement you can prove or disprove with data.
It follows a simple but powerful structure:
If we [Implement Change], then [Expected Outcome] will happen, because [Reasoning].
Let’s put this into a real-world scenario. Instead of just saying, "Let's test the CTA color," you formulate a proper hypothesis.
"If we change our primary pricing page CTA from blue to high-contrast orange, then we will increase trial sign-ups by 15% within 30 days, because the new color will create superior visual contrast against our brand palette, drawing more user attention to the desired action."
This structure forces you to clarify three things: what you're changing, what metric you expect to move, and why you believe it will work. That "why" is your learning. If the test fails, you've invalidated a specific assumption—incredibly valuable information for your next experiment.
Prioritizing Your Experiments with the P.I.E. Framework
You will never have a shortage of ideas for what to test. The challenge is deciding what to test first. To avoid this trap, use a prioritization model like the P.I.E. framework (Potential, Importance, Ease) to score each test idea objectively.
This scoring model helps you move past the "loudest voice in the room" and focus on data-backed priorities.
A/B Testing Prioritization Framework (P.I.E. Model)
| Experiment Idea | Potential (1-10) | Importance (1-10) | Ease (1-10) | Total Score |
|---|---|---|---|---|
| Change homepage headline to be more benefit-driven | 7 | 9 | 10 | 26 |
| Redesign entire checkout flow for a 3-step process | 9 | 10 | 3 | 22 |
| Add social proof (logos) below the trial sign-up CTA | 6 | 8 | 9 | 23 |
| Test a new pricing model (annual vs. monthly focus) | 10 | 10 | 2 | 22 |
| Change the primary CTA button color on the pricing page | 4 | 8 | 10 | 22 |
You score each idea on a scale of 1-10 for each category:
- •Potential: How much room for improvement is there? A page with a 95% drop-off rate has far more potential than one with a 10% drop-off.
- •Importance: How valuable is the traffic to this page? An experiment on your checkout page is far more important to revenue than a test on your "About Us" page.
- •Ease: How quickly and easily can this be implemented? A simple copy change is a '10', while a full pricing model rework is a '1'.
By scoring your ideas, you ensure you're always working on the highest-impact tests first. This disciplined approach is a cornerstone of effective funnel optimization.
Common Pitfalls That Invalidate Your Results
Getting the test right is just as important as choosing the right one. I’ve seen countless promising experiments ruined by simple errors.
Watch out for these common traps:
- •Testing Too Many Variables at Once: If you change the headline, CTA, and image in one test, you’ll have no idea which element caused the change. Stick to one change per test.
- •Running the Test for Too Short a Period: A two-day test might give you a "winner," but the results are likely just noise. You need to run tests long enough to reach statistical significance (usually a 95% confidence level) and account for weekly variations.
- •Ignoring External Factors: Did you launch a major PR campaign in the middle of your test? Did a holiday weekend skew your traffic patterns? Failing to account for these events can invalidate your results.
By avoiding these pitfalls, you transform your conversion efforts from random shots in the dark into a reliable system for generating predictable growth.
Connecting Marketing Spend to Revenue Outcomes
Do you really know which marketing channels bring in your most valuable customers? Pouring money into campaigns without a clear line of sight to revenue is one of the most common—and costly—mistakes a scaling company can make.
Without solid attribution, you're guessing which half of your marketing budget is working. Connecting ad spend directly to sales outcomes isn't a nice-to-have; it's the only way to confidently double down on what works.
This isn’t a small problem. The Conversion Rate Optimization (CRO) Software market in the Middle East and Africa alone was valued at USD 30.42 million in 2024, a clear signal that companies are desperate to refine user experiences. As businesses invest in tools to analyze customer behavior, the pressure to prove ROI is intensifying. You can find more on the MEA CRO market here.
Choosing the Right Attribution Model
Attribution isn't one-size-fits-all. Your model must reflect how your customers actually buy. A simple B2C product has a sales cycle of minutes. A complex B2B SaaS platform could involve months of research across dozens of touchpoints.
Here’s a quick rundown of the most common models:
- •
First-Touch Attribution: Gives 100% of the credit to the first interaction. Great for understanding initial awareness, but it ignores everything that happens next.
- •
Last-Touch Attribution: The opposite. All credit goes to the final touchpoint before conversion. It’s easy to measure but overvalues bottom-of-funnel activities.
- •
Multi-Touch Attribution (e.g., Linear, U-Shaped): Distributes credit across multiple touchpoints. A linear model gives equal weight to every interaction, while a U-shaped model credits the first and last touches most. This provides a far more balanced and realistic view of performance.
For most B2B SaaS companies with a considered sales cycle, a multi-touch model is the only way to get a true picture. It acknowledges that the initial blog post, the mid-funnel webinar, and the final demo request all played a role in winning the deal.
Making Attribution Actionable with UTMs
Attribution is useless without clean data. This is where a disciplined approach to Urchin Tracking Module (UTM) parameters becomes your secret weapon.
UTMs are simple tags you add to your URLs to tell your analytics and CRM exactly where a visitor came from. They are the breadcrumbs that let you trace a customer's entire journey.
Here’s what a well-structured UTM for a LinkedIn ad campaign looks like:
yourwebsite.com/landing-page?utm_source=linkedin&utm_medium=cpc&utm_campaign=q4-product-launch&utm_content=video-ad-1
Let's break that down:
- •utm_source: The platform (e.g.,
linkedin,google). - •utm_medium: The marketing type (e.g.,
cpc,email,organic_social). - •utm_campaign: The specific campaign name (e.g.,
q4-product-launch). - •utm_content: Differentiates ads within a campaign (e.g.,
video-ad-1vs.image-ad-2).
When you enforce this structure, your CRM (like HubSpot or Salesforce) can finally connect a new lead, an opportunity, and a closed deal back to the specific ad that started the journey.
The conversation shifts from "I think LinkedIn is working" to "Our Q4 LinkedIn campaign generated €120,000 in pipeline with a 90-day sales cycle." That clarity fuels revenue-focused conversion optimization.
Automating Growth and Improving Internal Handoffs
Some of the biggest conversion killers aren't on your website; they're buried in your internal processes. You can have the most persuasive landing page in the world, but if a high-intent lead waits hours for a follow-up, you’ve already lost. A clunky handoff between marketing and sales sabotages your best acquisition efforts.

A person uses a tablet displaying charts and data, with 'Automate Handoffs' on a purple screen.
This is where revenue quietly bleeds out. According to Gartner, B2B buyers now spend only 17% of their time meeting with potential suppliers. With such limited access, every interaction must be seamless and perfectly timed. Automation makes this possible.
From Manual Lag to Automated Speed
The goal is to build systems that slash human error and eliminate delays. Think about a high-intent lead who just requested a demo. Every minute they wait, their buying intent cools. This is where automated lead scoring and routing become mission-critical.
By setting up intelligent workflows in a platform like HubSpot or Pardot, you can ensure the right leads get to the right reps in minutes, not hours.
For example, a fintech company we worked with boosted its MQL-to-SQL conversion rate by 22% in a single quarter. The fix wasn't a website redesign; it was implementing an automated round-robin lead assignment that guaranteed a follow-up SLA of under two hours. That’s operational excellence that ensures no valuable lead ever falls through the cracks.
Nurturing Leads That Aren't Sales-Ready
Not every lead is ready to buy today. Automation lets you segment and nurture these prospects intelligently, keeping your brand top-of-mind.
Instead of letting a lead who downloaded a whitepaper go cold, enroll them in an automated workflow that delivers value over time:
- •Day 1: Send an email with a link to a related case study.
- •Day 4: Invite them to an upcoming webinar on a similar topic.
- •Day 10: Share a customer testimonial video.
This approach keeps them engaged without manual effort from your sales team. Then, when their lead score hits a certain threshold, automation can create a task for a rep to follow up personally.
The reality is, what happens after a user converts on your site is just as important as what happens before. A clunky, manual internal process creates friction that kills deals just as effectively as a slow-loading webpage.
Bridging the Gap Between Browsing and Buying
This need for a seamless journey is amplified in markets with high digital engagement but lower purchasing frequency. For instance, cart abandonment rates in the Middle East and Africa are around 91%, much higher than the global average. While 72% of UAE consumers browse online weekly, only a third buy that often, highlighting a massive opportunity to close the gap between interest and action.
This is where automation truly shines. By using behavior-triggered personalization and streamlined internal processes, you can guide users much more effectively from casual browsing to a completed purchase or signed contract.
Effective user onboarding is another crucial area. You can dive deeper into strategies for automating user onboarding to guide new users efficiently. Ultimately, a robust, automated handoff system is a core part of modern conversion optimization. It’s how you turn website traffic into a predictable revenue machine.
Your Common Conversion Optimization Questions Answered
Once you start building a systematic conversion optimization strategy, practical questions pop up. Getting straight, actionable answers is key to building momentum. Let's dig into some of the most common questions from RevOps leaders.
How Do I Know Where to Start Optimizing?
The most common mistake is trying to fix everything at once. Your starting point should be dictated by your data.
Start with a simple funnel analysis to find the biggest leak. Where are you losing the most prospects? Is it the drop-off from website visit to lead submission? Or the chasm between an MQL and a sales-accepted opportunity? The stage with the most significant drop-off has the highest potential for impact.
Focus your first experiments there. A small improvement at the weakest link will deliver a much bigger revenue impact than tweaking a step that's already performing well.
What Is a Realistic Improvement to Expect?
It’s tempting to search for a "silver bullet" experiment that will double your conversion rate overnight. While those stories make for great case studies, they are the exception. Real conversion optimization is a game of consistent, incremental gains.
A well-executed series of A/B tests can realistically deliver a 10-20% improvement in a specific conversion metric within a single quarter.
The real power comes from compounding these wins over time. A 15% lift in your demo request rate this quarter, followed by a 10% improvement in your trial-to-paid rate next quarter, creates significant, sustainable revenue growth. Consistency beats intensity every time.
How Much Traffic Do I Need for a Reliable Test?
Running an A/B test on a low-traffic page is a recipe for misleading results. To make confident, data-driven decisions, you need to hit statistical significance.
As a general rule of thumb, you need:
- •At least 1,000 unique visitors per variation (so 2,000 total for a simple A/B test).
- •A minimum of 100 conversions per variation.
If your traffic numbers are below this, shift your focus from quantitative A/B testing to qualitative analysis. Lean on heuristic analysis, user session recordings, and direct customer feedback to spot obvious friction points. Fixing a broken button or a confusing headline doesn't require a statistically significant test—it just requires common sense.
How Long Should an Experiment Run?
The duration of a test is as important as the traffic volume. An experiment that runs for only two days could be skewed by day-of-the-week effects (B2B traffic often peaks mid-week).
You should let your experiment run for at least one full business cycle, typically one to two weeks. This smooths out daily fluctuations and gives you a more accurate picture. The test ends when you reach your pre-determined sample size and statistical significance—not when you see an early result you like.
For a deeper dive into the systematic process of increasing desired actions on your website, consult this comprehensive guide to Conversion Rate Optimization.
By applying this disciplined, data-first approach, you can expect to see a 15–25% improvement in pipeline velocity within 6 weeks. At Altior & Co., we use this exact framework to uncover and fix the real revenue leaks in your funnel.
Learn how the 6-Week Revenue Growth Sprint applies this framework to your business.