Stop revenue leaks and drive predictable growth by mastering every stage of your customer lifecycle. A comprehensive RevOps guide for B2B SaaS founders.
The customer lifecycle isn’t some abstract marketing concept—it’s the real-world path a person takes from the moment they first hear about your solution to becoming a vocal advocate for your brand. It’s a map of every single interaction, every touchpoint, and every decision that shapes their relationship with your company.
Forget the traditional sales funnel for a second. Understanding this complete journey is the first, non-negotiable step to building a revenue engine that actually works, and this guide provides a step-by-step framework to get it right.
Why Your Customer Lifecycle Is Silently Leaking Revenue
Most B2B SaaS founders feel they have a decent grip on their customer lifecycle. You have a marketing team pumping out leads, a sales team closing deals, and a success team keeping customers happy. From the outside, it looks like a well-oiled machine.
But what if the data tells a completely different—and much more expensive—story?
The gap between how you think your funnel performs and reality is exactly where your revenue disappears.
This isn’t about a single catastrophic failure. It's about a series of small, almost invisible issues that quietly compound over time. Think of your revenue process less like a funnel and more like a high-pressure plumbing system. One loose fitting or a tiny crack seems harmless, but hundreds of them create a constant, costly drip. That’s precisely what’s happening with every slow lead handoff, inconsistent follow-up, and messy CRM entry.
The €8M ARR Blind Spot
For SaaS companies pushing past the €8M ARR mark, these minor drips turn into major floods. The "hustle and grind" that got you here is now the very thing holding you back. The game changes, and you’re suddenly facing more complex problems:
- •Inconsistent MQL Follow-up: Sales leaders often report 80% follow-up compliance, but CRM data frequently shows only 25% of MQLs are actioned within the first hour. That delay is fatal. A landmark study by Lead Response Management found that waiting just 30 minutes to contact a new lead can slash the odds of qualifying them by a staggering 21 times.
- •Murky Attribution: When your marketing and sales data live on separate planets, you can't answer the most fundamental question: "What’s actually driving revenue?" This leads to wasted ad spend and a go-to-market strategy built on gut feelings instead of hard facts.
- •Friction at Handoffs: The moment a lead is passed from marketing to sales, or a new customer from sales to success, is a critical failure point. Without clear SLAs and automated processes, you create friction that your customers feel instantly.
These operational gaps are just symptoms of a much deeper problem: a total disconnect between what your teams think is happening and what the data proves is happening.
To grasp the true financial hit, using a customer lifetime value calculator can paint a stark picture of the potential you're losing. Identifying and plugging these hidden drains is the core of Revenue Operations—and the first real step toward building a growth engine that can scale.
You can dive deeper into how to spot and fix these costly issues with our guide to finding revenue leakage in your own operations.
Mapping the Six Stages of the Modern Customer Lifecycle
If you want to plug revenue leaks, you first need a clear blueprint of the entire system. Too often, B2B SaaS companies see the customer journey through siloed lenses—Marketing sees leads, Sales sees deals, and Customer Success sees support tickets. This fragmented view is exactly why opportunities fall through the cracks and potential revenue vanishes into thin air.
The modern customer lifecycle isn't just a simple, top-to-bottom funnel; it's a dynamic, cyclical engine. Getting a handle on its distinct stages is the first real step toward building a revenue operation that’s actually driven by data. We've broken it down into six core phases, moving past the textbook definitions to focus on what truly matters in a high-growth SaaS world.
This is what happens when things go wrong. Messy handoffs, slow response times, and bad data cause the whole system to spring leaks.
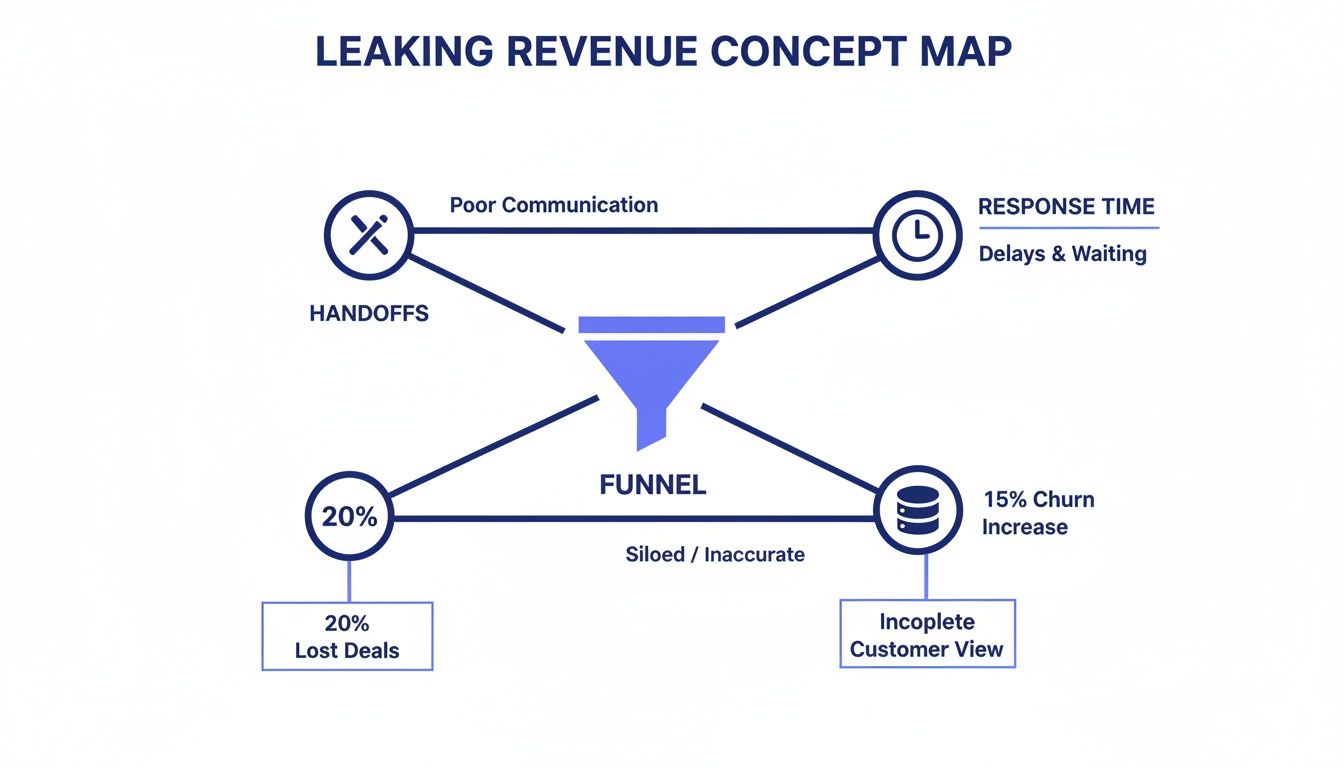
Concept map of leaking revenue, showing a funnel with issues like poor communication, handoffs, and incomplete customer data.
As you can see, these aren't isolated incidents. They're systemic problems that stop you from delivering value to your customers—and capturing it for your business.
Now, let’s map the journey the right way.
The Six Foundational Stages
Building a scalable revenue engine means every team has to understand their role and how their performance directly impacts the next stage. It’s all about creating a seamless flow, not just executing a series of disconnected tasks.
Here's a practical map that shows how each stage connects to a business goal, which teams are on the hook, and the one metric that tells you if you're winning.
The Six B2B SaaS Customer Lifecycle Stages Mapped
| Lifecycle Stage | Primary Goal | Key Teams Involved | Critical Success Metric |
|---|---|---|---|
| Awareness | Become a trusted voice and educate the market on the problem you solve. | Marketing, Content | Qualified Website Traffic |
| Acquisition | Capture intent and convert anonymous visitors into known leads. | Marketing, SDRs/BDRs | Marketing Qualified Leads (MQLs) |
| Activation | Deliver the "Aha!" moment where potential value becomes tangible. | Sales, Product, Sales Engineering | Sales Qualified Leads (SQLs) / Product Qualified Leads (PQLs) |
| Revenue | Convert activated interest into a paying customer smoothly. | Sales, Legal, Finance | New Bookings (ACV/ARR) |
| Retention | Ensure customers achieve their desired outcomes and renew. | Customer Success, Support, Product | Net Revenue Retention (NRR) |
| Referral | Turn happy customers into active brand advocates. | Customer Success, Marketing | Customer Referrals / Case Studies |
This table provides a high-level view, but let's dig into what each stage really means for your teams on the ground.
1. Awareness Your future customers have a problem, and they're just starting to look for answers. They might not even know your brand exists yet. The goal here isn't a hard sell; it's to become a trusted, authoritative voice in the conversation they're already having. This is all about educating and building credibility.
2. Acquisition This is the moment a prospect metaphorically raises their hand. They shift from passively reading your blog posts to actively engaging by downloading a whitepaper, signing up for a webinar, or—the holy grail—requesting a demo. The focus moves from broad education to capturing specific intent.
3. Activation Activation is that critical "Aha!" moment. For a product-led company, it’s when a trial user actually experiences the core value of your platform. For a more traditional sales-led motion, it’s when a prospect on a discovery call finally sees how your solution solves their specific pain point. This is where potential value becomes real.
"If a lead is ready to become a customer, the marketing department must be prepared, operationally and technologically, to smoothly guide that person to the sales team." - A Forbes Business Development Council Member
This quote perfectly captures why a systemized handoff between Acquisition and Activation isn't just a nice-to-have; it's non-negotiable.
4. Revenue This is the finish line of the sales process: the moment a prospect becomes a paying customer. But it’s so much more than just a "Closed-Won" status in your CRM. This stage covers everything from the initial quote to the final signature and first payment. A clunky, slow process here can sour a great sales experience and set the entire customer relationship off on the wrong foot.
5. Retention Once the first invoice is paid, the real work begins. Retention is about making sure customers repeatedly achieve their desired outcomes with your product. It’s a mix of proactive support, continuous value delivery, and building a relationship strong enough to survive price increases and competitive offers. In SaaS, retention isn't just part of the business—it's the very foundation of profitable growth.
6. Referral This is the final and most powerful stage. It’s when your happy customers become your best salespeople. They don’t just renew; they bring you new business through word-of-mouth, agree to be case studies, and leave glowing reviews. This stage feeds the very top of the lifecycle, creating the ultimate self-sustaining growth loop.
Understanding these six stages gives you a practical framework to diagnose exactly where your revenue engine is breaking down—and a clear map for how to fix it.
Diagnosing Bottlenecks in Your Acquisition and Activation Funnel
The first two stages of the customer lifecycle—Acquisition and Activation—are where your most expensive revenue leaks spring. This is the critical handoff where high-intent leads either glide smoothly into your pipeline or simply vanish. The problem is, too many leaders operate on gut feelings, chalking up a slump to "slow sales" instead of zeroing in on the specific operational breakdown that’s bleeding cash.

Hands holding a stopwatch over a laptop displaying data charts, emphasizing efficiency and fixing bottlenecks.
To stop guessing, you need a diagnostic toolkit. The objective is to swap assumptions for mathematical certainty by obsessing over the core metrics that actually drive top-of-funnel performance. This isn't about esoteric analytics; it's about getting the fundamentals right and measuring them relentlessly.
Quantifying the Fundamentals That Drive Growth
Three metrics tell you almost everything you need to know about the health of your early-stage lifecycle: lead response time, MQL-to-SQL conversion, and trial-to-paid conversion. Let's break down how to diagnose each one.
1. Lead Response Time: The Silent Killer
How long does it really take for your sales team to contact a new MQL who just asked for a demo? Your sales leader might report stellar compliance, but the CRM data often tells a much uglier story. A delay measured in hours, not minutes, is a direct path to lost revenue.
Picture this: a hot prospect fills out your demo form at 9 AM. If your process relies on a human manually assigning that lead, it might not get a call until after lunch. By then, they’ve already booked meetings with two of your competitors. The urgency is gone.
Industry data consistently shows that responding within the first five minutes can increase lead conversion rates by up to 900%. If your average response time is six hours, you're not just slow—you're actively forfeiting nearly 40% of your potential demos before the race even begins.
2. MQL-to-SQL Conversion: The Handoff Test
This metric is the ultimate stress test for the handoff between your marketing and sales teams. A low conversion rate is a blaring alarm that signals a critical misalignment. Is marketing sending over junk leads, or is sales dropping perfectly good ones?
To figure it out, dig into the data:
- •Rejection Reasons: Are your reps constantly flagging MQLs as "unqualified" or "bad timing"? If so, you have a lead-scoring problem, not a sales problem.
- •Time-in-Stage: How long do MQLs sit in a queue before being accepted or rejected? If it’s more than a few hours, you have a process bottleneck.
- •Source Performance: Do leads from webinars convert to SQLs at a much lower rate than demo requests? This pinpoints exactly where your lead quality issues are.
Fixing this isn't about a blame game. It’s about forging a clear Service Level Agreement (SLA) that defines exactly what an MQL is and sets a non-negotiable timeframe for follow-up.
The Role of Investment in Regional Markets
Diagnosing these lifecycle bottlenecks is becoming a global priority, especially in fast-growing digital economies. For B2B SaaS and fintech companies in the Middle East & Africa (MEA), the landscape has shifted dramatically. The MEA CRM market was valued at approximately USD 4.06 billion in 2025, an investment surge driven by the urgent need for tools that can track and optimize these very metrics. This spending underscores the dominance of digital channels and the necessity for robust systems to measure CAC and lifecycle performance with precision. You can explore more about the growth drivers in the MEA CRM market.
3. Trial-to-Paid Conversion: The Value Gap
For any product-led company, this is the final exam for your Activation stage. A poor trial-to-paid conversion rate means one of two things: you're attracting the wrong kind of user, or your product fails to deliver that "Aha!" moment fast enough.
To find the friction, you have to become an expert in user behavior. Where are trial users dropping off? Are they getting stuck on a particular feature? A common mistake is just assuming users will figure it out. The winning strategy is a targeted onboarding sequence—triggered by user actions (or inactions)—that guides them straight to the value they need to see.
For instance, a FinTech client of ours saw a huge drop-off after users invited a team member but never actually assigned a task. By implementing an AI-powered automation that triggered an in-app guide right after the invite, they boosted task creation by 60% and lifted their trial-to-paid conversion from 12% to 18% in just six weeks.
Ready to start your own diagnosis? Use our downloadable checklist to find where your funnel is leaking.
[Download Now The 12 Signs Your Top-of-Funnel Is Leaking Revenue Checklist]
RevOps Plays to Maximize Revenue and Retention
Once a customer signs on the dotted line and the first payment hits, the real work begins. The game flips entirely from acquisition to delivering on your promise and driving long-term value.
This is where a smart Revenue Operations function becomes your secret weapon, turning post-sale activities from a cost center into a powerful engine for expansion revenue and retention.
The goal is no longer just to close a deal; it's to maximize Net Revenue Retention (NRR), arguably the single most important metric for sustainable SaaS growth. Smart RevOps plays turn the later stages of the customer lifecycle into a predictable system for increasing customer lifetime value.
Standardize the Sales Cycle to Accelerate Wins
One of the quickest ways to boost revenue is to shorten the time it takes to get there. A disorganized sales process with fuzzy deal stages is a massive source of friction. When reps use different criteria for "Proposal Sent" or "Negotiation," your pipeline forecasts become pure guesswork.
A core RevOps play is to standardize these stages right inside your CRM. Every single stage must have clear entry and exit criteria that everyone on the team understands and follows. This isn't just about administrative tidiness; it’s about creating a common language for your entire revenue engine.
"If a lead is ready to become a customer, the marketing department must be prepared, operationally and technologically, to smoothly guide that person to the sales team." - Forbes Business Development Council Member
This principle extends across the entire customer journey. Once stages are locked down, you can start implementing automated alerts. For example, an automation can ping a sales manager and the RevOps team if a high-value opportunity sits in the "Negotiation" stage for more than ten business days without any forward movement.
This simple system turns your CRM from a passive database into an active coach, preventing deals from dying on the vine. To truly maximize revenue and combat churn, it's vital to implement robust customer retention marketing strategies to build that loyal customer base.
Proactively Manage Retention with Data
The best way to fight churn is to see it coming. Instead of reacting when a customer sends a cancellation email, RevOps empowers your Customer Success (CS) team to act proactively based on data triggers. This means moving beyond gut feelings and into quantitative customer health scores.
These scores combine several data points into a single, actionable metric:
- •Product Usage Data: Are they logging in frequently? Are they using your stickiest features? A sudden drop-off is a major red flag.
- •Support Tickets: Is there a spike in the number or severity of support requests? This often signals frustration.
- •Survey Responses: What are their latest Net Promoter Score (NPS) or Customer Satisfaction (CSAT) results telling you?
By building a health score dashboard, you can create automated alerts for the CS team when a key account's score drops below a certain threshold. This allows them to intervene with targeted support or training before the customer relationship is at risk.
This kind of proactive, data-driven approach is critical in markets with high service expectations. For instance, in the UAE, 62% of consumers prioritize customer service, and a whopping 87% say personalized offers make them shop more frequently. It's clear evidence that responsiveness directly impacts revenue.
Finally, a data-driven Quarterly Business Review (QBR) process is the ultimate play for proving value. By arming your CS team with dashboards showing the customer's ROI and usage trends, you transform the QBR from a simple check-in to a strategic conversation. This naturally uncovers upsell and cross-sell opportunities.
You can learn more about how to implement similar strategies in our guide to building a RevOps framework.
How to Build Your Customer Lifecycle Dashboard in Six Weeks
You can't fix what you can't see. Most revenue leaders are flying blind, trying to piece together a coherent story from siloed reports scattered across marketing, sales, and success teams. This section lays out a practical, week-by-week blueprint to build your single source of truth—a dashboard that finally shows you how your entire revenue engine is actually performing.
This isn't just theory. The plan mirrors a typical 6-Week Revenue Growth Sprint, designed to drag you out of data chaos and into a state of diagnostic clarity. It's about building the systems that tell you what’s really working.

Modern desk setup with two computers displaying interactive dashboards, a keyboard, and notebooks on a blue mat.
Week 1: Audit Your Data Stack and CRM Hygiene
Before you can build anything meaningful, you have to inspect the foundation. Week one is a no-holds-barred audit of your current data sources and the state of your CRM. The goal here is simple: find and tag every critical data point you need to measure the customer journey from start to finish.
It’s time to ask the hard questions:
- •Data Integrity: Are lead sources actually tracked consistently? Are your deal stages just vague labels, or do they have concrete entry and exit criteria? A HubSpot report found that nearly 27% of data in the average company's database is just plain wrong—a flaw that makes any dashboard completely useless.
- •System Integration: Does your marketing automation platform even talk to your CRM? And does your CRM sync with your product analytics tool? Disconnected systems are ground zero for the attribution blind spots that kill your ROI.
- •Property Mapping: Pinpoint the exact fields you'll need. This means
Lead Source,MQL Date,SQL Date,Closed-Won Date, andCustomer Since Dateare non-negotiable.
By the end of this week, you should have a complete map of every data point you need and a painfully clear picture of where your data quality gaps are.
Weeks 2-3: Implement Precise Tracking
With your data map in hand, the next two weeks are all about implementation. This is where you get your hands dirty and plug the leaks you found in the audit. It's tedious, technical work, but the payoff is massive.
Your entire focus should be on creating rock-solid tracking for the key conversion points across the lifecycle. This usually involves:
- •Standardizing Properties: Force consistent use of CRM fields across every team. Use dropdown menus instead of free-text fields wherever you can—it’s the single best way to kill messy data.
- •Automating Timestamps: Build workflows that automatically timestamp critical events, like the exact moment a lead becomes an MQL or an opportunity hits the proposal stage. Manual data entry is the enemy of accuracy.
- •Implementing Hidden Fields: Use hidden fields on your web forms to grab UTM parameters and first-touch attribution data without anyone lifting a finger.
This phase is all about making sure every important handoff and milestone is captured automatically and accurately. No exceptions.
Weeks 4-5: Build Your Visualizations
Now for the fun part. With clean, reliable data finally flowing into your systems, you can start building the dashboard itself. It doesn’t matter if you’re using your CRM’s native reporting (like HubSpot or Salesforce) or a dedicated BI tool like Tableau or Looker—the principles are the same.
Start by creating widgets for each stage of the lifecycle:
- •Acquisition: Track MQLs by source and lead velocity rate.
- •Activation: Monitor your MQL-to-SQL conversion rate and demo-to-close rate.
- •Revenue: Visualize pipeline velocity and your average sales cycle length.
- •Retention: Display Net Revenue Retention (NRR) and customer health scores.
Your dashboard shouldn’t just spit out numbers; it needs to tell a story about your customer’s journey. The goal is to see the flow—or the friction—from one stage to the next in a single glance.
For a deeper dive into the metrics that matter, check out our complete guide to revenue analytics.
Week 6: Analyze and Set Benchmarks
The final week is about turning raw data into actual intelligence. Your dashboard is live. Now it's time to analyze what it’s telling you and establish your first real performance benchmarks.
Hunt for the outliers and start asking "why." Why is the sales cycle for our inbound leads 30 days shorter than for outbound? Why did our MQL-to-SQL rate suddenly tank by 15% last month? This is where your new dashboard transforms from a report into a powerful diagnostic tool, guiding your strategy with objective truth instead of gut feelings.
By following this six-week sprint, you’re not just building another report. You're building a permanent, scalable system for total visibility across the entire customer lifecycle, empowering you to spot leaks and jump on opportunities with confidence. Expect a 15–25% improvement in pipeline velocity within 6 weeks of implementing this system.
Your Top Customer Lifecycle Questions, Answered
B2B SaaS leaders are always asking us how to get a better handle on their customer lifecycle. Here are some of the most common questions—and our straight-from-the-trenches answers.
We Have Messy Data. What’s the First Step to Mapping Our Journey?
Don't try to build the perfect map right away. The goal isn’t perfection; it’s establishing a single source of truth, even if it’s a simple one.
Forget about the hundreds of data points you could track. Start by isolating the five most critical milestones you absolutely need: Lead Creation Date, MQL Date, SQL Date, Closed-Won Date, and Churn Date.
Focus all your initial energy on cleaning and standardizing just those fields in your CRM. Then, put simple automation in place to timestamp these events accurately from this point forward. This gives you a foundational skeleton of the customer lifecycle—a clear, simple timeline that you can actually build on, instead of just staring at a chaotic mess.
How Often Should We Be Looking at Our Lifecycle Metrics?
You need to match your review cadence to the speed of each stage. One size doesn't fit all.
- •
Top-of-Funnel Metrics (Weekly): Things like lead response times, MQL volume, and MQL-to-SQL conversion rates are your canaries in the coal mine. Review them every single week. They move fast and can give you an immediate heads-up if a marketing campaign is failing or your sales follow-up has broken down.
- •
Mid-Funnel Metrics (Bi-Weekly/Monthly): Metrics like pipeline velocity, sales cycle length, and demo-to-close rates can be checked every two to four weeks. These reveal the deeper, underlying trends in how effective your sales process actually is.
- •
Post-Sale Metrics (Monthly/Quarterly): Net Revenue Retention (NRR), customer health scores, and churn rates are lagging indicators. They reflect long-term value. A monthly check-in is good, but a deep-dive analysis every quarter is where you'll find the most strategic insights.
What Automation Tools Are Actually Effective for Lead Handoffs?
The entire point of automation here is to kill human error and make your Service Level Agreements (SLAs) a reality. The best tools are the ones built right into your CRM or those that connect to it without any drama.
Get these three things working, and you’ll solve most of your handoff problems:
- •Automated Lead Routing: Use round-robin or territory-based rules to get new MQLs to the right sales rep instantly. This one piece of automation alone can take your lead response time from hours down to minutes.
- •Automated Notifications: Set up instant Slack or email alerts that fire the moment a rep gets a new lead. No more excuses about "not seeing it" in the CRM.
- •Automated Re-engagement: If a lead sits untouched past your SLA (say, 2 hours), have an automation either reassign it or ping a sales manager. This creates a closed-loop system of accountability.
A shocking 79% of marketing leads never convert to sales, according to Salesforce. The biggest reason? A total lack of nurturing and painfully slow follow-up. This is exactly what automation fixes—it builds a system where no lead gets left behind.
Ready to stop guessing and start building a predictable revenue engine? The team at Altior & Co. applies these principles in our 6-Week Revenue Growth Sprint to give you complete visibility and control over your customer lifecycle. Learn how the sprint can deliver a clear growth blueprint for your business.