Unlock demand generation with our proven B2B SaaS playbook, designed to build a predictable revenue engine and drive sustainable growth.
Demand generation isn't just another marketing buzzword; it's a strategic, full-funnel approach focused on creating awareness and desire for your solution. This is fundamentally different from lead generation, which is purely about capturing interest that already exists.
Real demand generation educates your entire target market. It builds the kind of trust and authority that makes your solution the only one they think of when a problem becomes urgent. Are you ready to build an engine that pulls your best customers toward you?
Moving Beyond Leads to Create Real Demand

A detailed mechanical engine model on a reflective table, with professionals in a meeting background and a 'DEM-AND OVER LEADS' sign.
Let’s be honest. Your go-to-market team is probably confusing lead generation with demand generation. If you're still chasing Marketing Qualified Leads (MQLs), gating every piece of content, and measuring success by the number of contacts in your database, you’re running a leaky, inefficient revenue engine.
This is a massive perception gap we see all the time. Teams think they're generating demand, but they're really just fighting over the tiny 5% of the market that’s actively buying right now, according to research from The LinkedIn B2B Institute.
This old-school approach completely ignores the 95% of potential buyers who aren't in-market today but will be in the coming months. True demand generation is about winning over this massive, untapped audience before they even start looking.
The Critical Mindset Shift
The real change happens when you shift from a transactional mindset ("How can we get their email?") to an educational one ("How can we become the most trusted resource in our category?"). You stop forcing your way into a conversation and start getting invited into one.
This isn't just a philosophical change; it has a direct, measurable impact on your revenue.
- •Shorter Sales Cycles: Buyers who find you through your educational content are already sold on the problem and trust your expertise.
- •Higher Average Contract Value (ACV): Educated buyers understand the value you provide. They don't haggle over price.
- •Predictable Growth: You stop relying on volatile lead volumes and start building a sustainable engine that pulls your ideal customers toward you.
"True demand generation is making your market smarter. It’s not a tactic, it's a program." — Chris Walker, CEO at Refine Labs
Capturing vs. Creating Demand
Think of it this way: lead generation is like fishing in a small, overcrowded pond where everyone is using the same bait. Sure, you might catch something, but the competition is brutal.
Creating demand is like building a thriving, healthy ecosystem that naturally attracts the best fish straight to you.
A Fintech client we worked with is a perfect example of this in action. They reallocated their budget away from bottom-funnel "demo request" ads and poured it into creating an ungated CFO benchmarking report. While their raw lead volume dipped at first, the number of sales-qualified opportunities from their ideal customer profile shot up by 40% in just three months.
Even better, their sales cycle shortened by nearly 30 days because prospects were showing up to the first call already educated and convinced.
This playbook is your blueprint for building a system that delivers real business outcomes—not just a bigger contact list. For a deeper dive into the core principles, you can explore our complete guide to the meaning of demand generation and its role in a modern revenue engine.
Your Foundational Revenue Operations Audit

Laptop displaying data analytics charts with a magnifying glass and 'AUDIT YOUR FUNNEL' text.
You can't build a powerful demand generation engine on a cracked foundation. Before you launch new campaigns, you need a brutally honest assessment of your current Go-to-Market (GTM) motion. This isn't about surface-level tweaks; it’s a diagnostic deep dive to uncover the hidden leaks bleeding revenue from your funnel. The goal is to move from assumptions to absolutes, ensuring every euro you invest lands on solid ground.
Uncovering the Perception Gap
In most GTM teams, the biggest challenge isn't a lack of effort—it's the massive gap between what leadership thinks is happening and what the data proves. Leadership might believe leads are followed up on within hours, but the CRM often tells a far more painful story.
It's a common blind spot. A study cited by HubSpot revealed that the average lead response time for businesses is a staggering 42 hours. This is where perfectly good opportunities go to die. Your audit's first job is to expose these gaps with cold, hard data, replacing anecdotes with analytics.
We consistently find that sales leaders report 80-90% compliance with follow-up SLAs. Dig into the CRM activity logs, however, and the true figure is often closer to 25%. This isn't about placing blame; it's about identifying a broken process that better routing and automated alerts can actually fix.
To start, you need a single source of truth. Get your sales and marketing data aligned to build one clear, end-to-end view of the customer journey. Without it, you're just looking at disconnected puzzle pieces.
Your Diagnostic Framework Questions
To guide your audit, start asking questions that challenge your team's core assumptions. Dig into your CRM, marketing automation platform, and analytics to find the real answers. The insights you uncover here will become the bedrock of your entire demand generation strategy.
- •Lead Handoff: What's the actual time between a lead creation timestamp in your MAP and the first sales activity logged in the CRM? Is it minutes, hours, or days?
- •Conversion Rates: What is our true MQL-to-Opportunity conversion rate? More importantly, where does it break down between stages like "Working" and "Qualified"?
- •Stage Velocity: How long do prospects really sit in each sales stage? Is the "Discovery" stage a 14-day process or a 45-day black hole where deals go stale?
- •Data Integrity: What percentage of contact records are missing key data points like job title, industry, or company size that are essential for effective segmentation and routing?
Answering these questions means looking at your systems holistically. It’s crucial to assess how well your various Marketing SaaS solutions are integrated. Are these tools talking to each other, or are they creating the very data silos you're trying to break down?
The disconnect between perceived performance and actual data can be shocking. Here’s a table outlining what we typically find during an initial audit:
Key Funnel Metrics: Perception vs. Reality
This diagnostic table shows the common discrepancies we uncover when comparing what teams report versus what the data actually says.
| Metric | Common Perception (Reported by Teams) | Data-Driven Reality (Found in CRM/Analytics) | What This Gap Indicates |
|---|---|---|---|
| Lead Follow-Up Time | "We hit our 4-hour SLA on all hot leads." | Average time to first touch is 38 hours; only 22% of MQLs are contacted within 4 hours. | Broken lead routing, lack of sales alerts, or unclear ownership. |
| MQL-to-SQL Conversion | "Marketing sends over about 50% qualified leads." | The actual MQL-to-SQL rate is 18%, but it varies wildly by campaign (from 5% to 60%). | Misaligned lead scoring, poor campaign targeting, or a broken handoff process. |
| Sales Cycle Length | "Our average sales cycle is 90 days." | The median sales cycle is 125 days, with deals stalling for 30+ days in the "Proposal" stage. | Ineffective follow-up cadences, lack of deal momentum plays, or unclear next steps. |
| CRM Data Completeness | "Our data is pretty clean; we have all the key fields." | 35% of contact records are missing a job title, and 50% are missing a direct phone number. | Inadequate data enrichment, poor form strategy, or a lack of data governance. |
Seeing the reality laid out like this is often the catalyst for real change. It moves the conversation from opinions to objective facts that everyone can rally around to fix.
From Diagnosis to Actionable Insights
Once you have this data, you can build a clear picture of what's actually happening. You’ll move from vague problems like "our funnel is leaky" to specific, solvable issues like, "We lose 40% of MQLs because our lead routing is manual and takes over 24 hours to assign a rep."
This level of clarity is the very core of effective revenue operations. It transforms your demand generation from a series of disconnected campaigns into an integrated, measurable, and predictable growth engine. Our deep-dive into revenue operations provides a comprehensive look at building these systems for scale.
This audit isn't a one-time task. It's the foundational discipline that allows you to build, measure, and iterate on a demand generation strategy that delivers real, predictable revenue—not just vanity metrics.
Designing Campaigns That Your ICP Will Thank You For
Great demand generation isn't about running more campaigns; it's about running the right ones. Now that you've diagnosed the leaks in your revenue engine, it's time to design integrated campaigns that hit home with your Ideal Customer Profile (ICP). This is where strategy meets execution.
Forget the generic advice to ‘create valuable content.’ Your real goal is to create assets your audience would willingly pay for—assets that educate, build trust, and subtly position your solution as the only logical choice.
Mapping Content to the Buyer’s Journey
Effective campaigns don't just target a persona; they target a specific moment in that persona's journey. Before you design a single thing, you have to be crystal clear on who you're talking to. To focus your efforts, you first need to identify your ideal customer profile with precision.
Once you know them inside and out, you can map your content strategy to their buying process. This ensures you're delivering the right information at the right time, guiding them from problem-awareness to solution-selection without ever feeling like you're selling.
- •Problem Awareness (Top of Funnel): Your ICP knows they have a problem but doesn't have a name for it or know how to solve it. Content here should be purely educational. Think ungated benchmarking reports, industry trend analyses, or insightful podcast episodes. The goal is to build authority and trust.
- •Solution Exploration (Middle of Funnel): Now they’re actively researching solutions. This is where you introduce product-led webinars, detailed case studies, or comparison guides that help them evaluate their options. You can gate this content to capture high-intent leads.
- •Vendor Selection (Bottom of Funnel): They’ve narrowed down their choices and are ready to buy. Content at this stage is all about removing final barriers. Think implementation guides, security whitepapers, and customer testimonials that overcome last-minute objections and build confidence.
This methodical approach ensures your entire demand generation effort is cohesive, guiding prospects seamlessly through their decision-making process.
From Diagnosis to a Pillar Content Blueprint
Your audit didn't just find problems; it handed you a content strategy on a silver platter. If your diagnosis showed that deals are constantly stalling in the "Proposal" stage, your first campaign could be a pillar content piece titled "The CFO's Guide to Building a Bulletproof Business Case for [Your Solution Category]."
This approach transforms a vague topic into a powerful demand engine. For a deeper dive on connecting these dots, check out our post on building a cohesive go-to-market strategy.
Let's look at how this plays out in the real world.
Case Study: How Company X Increased Trial-to-Paid Conversion by 50%
A B2B SaaS client in the project management space was struggling with low trial-to-paid conversion. Their marketing felt generic, and their sales team was hitting a wall trying to prove value.
Instead of another boring eBook, we helped them use their internal data to create "The 2024 Project Management Efficiency Report." It was an ungated, high-value asset packed with unique insights into the things their ICP actually cares about—bottleneck identification, resource allocation, and project ROI.
The results were immediate and powerful:
- •High-Quality Engagement: The report was downloaded over 1,500 times in the first month, almost entirely by their target ICP of Project Managers and VPs of Operations.
- •Pipeline Generation: Within the first quarter, they traced €350,000 in new pipeline directly back to conversations that started with that report.
- •Trial-to-Paid Conversion: They increased trial-to-paid conversion from 12% to 18% in just 6 weeks, a 50% improvement, because new users were already convinced of the value proposition.
This campaign worked because it stopped selling and started serving. The report became an authoritative resource that positioned them as trusted advisors, not just another vendor pushing a product.
Uncovering "Dark Social" Insights
The best content ideas almost never come from keyword research tools. They come from listening to how your ICP actually talks about their problems. This happens in "dark social"—the private channels like Slack communities, LinkedIn DMs, and closed-door industry events.
"Your best marketers are already on your team—they're your sales reps and customer success managers. They hear the voice of the customer every single day." — Jason Lemkin, Founder of SaaStr
Your sales and customer success teams are sitting on a goldmine of these insights. Set up a simple system, like a dedicated Slack channel, where they can drop the exact language customers use to describe their challenges. These raw, unfiltered questions and pain points are the fuel for content that truly connects and builds the trust you need for effective demand generation.
Putting Your Plan Into Action: The 12-Week Demand Generation Sprint
A brilliant strategy is worthless without disciplined execution. After diagnosing your funnel and designing high-impact campaigns, it’s time to turn those ideas into action. This is where the rubber meets the road—a concrete, 12-week sprint designed to build momentum, deliver measurable results, and prove the value of your new demand generation engine.
This isn't about boiling the ocean. It's an operational blueprint for getting quick wins on the board, demonstrating progress, and building the organizational muscle for continuous improvement. We’ll break it down into manageable phases, defining clear ownership and what success actually looks like at each step.
Weeks 1–2: Foundational Alignment and Tech Stack Audit
The first two weeks are all about getting your house in order. You can't launch, measure, or optimize anything if your systems are a mess or your data is garbage. This phase is owned by Revenue Operations, but it needs heavy involvement from marketing and sales leadership to work.
The primary goal is to establish a single source of truth. That means validating the data sync between your marketing automation platform (like HubSpot) and your CRM (like Salesforce). It’s not just a technical exercise; according to Forrester, companies with tightly aligned sales and marketing teams see up to 32% annual revenue growth, compared to a 7% decline for their less-aligned peers. That alignment starts here, in the plumbing of your tech stack.
Your checklist for this phase should include:
- •Data Integrity Check: Confirm that lead source, campaign attribution, and key demographic fields are correctly mapping from your MAP to your CRM. No excuses.
- •SLA Confirmation: Re-establish and automate lead routing rules and follow-up SLAs. For example, all MQLs from a specific high-intent campaign must be assigned and contacted within 4 hours.
- •Dashboard Setup: Build the foundational dashboards you'll use to track the sprint. Focus on leading indicators like engagement scores and lagging indicators like pipeline created.
Weeks 3–6: Pillar Content Creation and Campaign Launch
With a solid foundation, you can now move into creation and activation. This phase is marketing-led, but you need significant input from sales and product. If the content doesn't solve a real customer pain point, it’s just noise.
This is when you build and launch that first pillar content asset you designed based on your audit. Whether it’s a benchmarking report, an in-depth guide, or a thought leadership webinar, the focus is quality over quantity. The goal is to create something your ideal customer would genuinely thank you for.
"You have to create content that is truly great. The bar for 'good enough' is gone. If you aren't creating the best content on the internet for your keyword or your topic, you're not going to get any results." — Neil Patel, Co-founder of NP Digital
During this phase, you'll:
- •Finalize the Asset: Get the content, design, and any associated landing pages or creative locked and loaded.
- •Plan Distribution: Outline exactly how you'll promote the asset. This includes owned channels (email, social), paid channels (LinkedIn ads, content syndication), and earned channels (PR, influencer outreach).
- •Launch and Promote: Pull the trigger on the distribution plan. Success here isn’t measured by downloads, but by engagement from accounts that match your ICP.
Weeks 7–10: Optimization and Cadence Activation
Now that your campaign is live, the focus shifts from creation to data-driven optimization and sales activation. This is a true partnership between marketing, who analyzes the engagement data, and sales, who acts on those signals.
You’re looking for the early indicators of success. Which companies are engaging? Which job titles show the most interest? This intelligence, often found in "dark social" and platform analytics, fuels your next move. Marketing's job is to analyze this data and feed sales a prioritized list of engaged accounts.
Sales then uses these insights to launch highly relevant, non-generic outreach. Instead of a cold "saw you downloaded our eBook" message, the outreach becomes, "I saw your team was interested in our CFO benchmarking report, specifically the section on forecasting accuracy. We just helped a similar company reduce their forecasting variance by 15% in six weeks. Is that a challenge you're currently tackling?"
Weeks 11–12: Reporting and Planning the Next Sprint
The final two weeks are for measuring results and planning your next move. This is RevOps’ time to shine, translating campaign activity into business impact and setting the stage for the next sprint.
You need to analyze the full-funnel impact. How many target accounts engaged? How many of those turned into meetings? What's the initial pipeline value generated from this sprint? A successful sprint should show a measurable lift, like a 15–25% improvement in pipeline velocity within this initial 12-week period.
This whole process is a continuous cycle of diagnosis, action, and measurement. By breaking your demand gen efforts into these focused sprints, you move from random acts of marketing to a predictable, repeatable system for driving revenue growth.
Here’s a high-level look at how the 12-week sprint comes together, outlining the key activities, who owns them, and what success looks like.
12-Week Demand Generation Sprint Blueprint
| Phase (Weeks) | Key Activities | Primary Owner (Dept) | Success Metric |
|---|---|---|---|
| 1–2 | Tech stack audit, data sync validation, SLA confirmation, dashboard setup. | Revenue Operations | 100% data sync accuracy; automated lead routing live. |
| 3–6 | Finalize pillar content asset, build landing pages, plan distribution, launch multi-channel campaign. | Marketing | Asset live; >50% of initial engagement from ICP accounts. |
| 7–10 | Analyze engagement data, identify high-fit accounts, launch personalized sales cadences, A/B test ads. | Marketing & Sales | >10% of engaged accounts move to the "Meeting Booked" stage. |
| 11–12 | Full-funnel performance analysis, calculate pipeline generated, document learnings, plan next sprint. | Revenue Operations | >3x ROI on sprint investment (pipeline value vs. cost). |
This blueprint isn't just a project plan; it's a commitment to a new way of operating. By holding each team accountable for their part, you build the foundation for a truly predictable revenue engine.
Measuring What Matters for Predictable Growth
If you can’t measure it, you can’t improve it. This is where we stop guessing and start building a predictable revenue engine. And yes, this means finally tackling the thorniest part of the process: attribution.
Without solid measurement, you're just throwing money into a black box. A scenario I see all the time is teams getting hooked on last-touch attribution, which completely ignores the top-of-funnel work that built awareness and trust in the first place. This myopic view is exactly why marketing budgets get cut for the very campaigns that create future demand.
Moving Beyond Last-Touch Attribution
Simplistic last-touch attribution is the enemy of a modern demand generation strategy. It’s a lazy model that incorrectly gives 100% of the credit to whatever a prospect clicked right before they converted, like a demo request form.
But what about the weeks or months before that click? What about the blog posts they read, the podcast they listened to, or the social content they engaged with? Those touchpoints are invisible to a last-touch model.
This creates a classic perception vs. reality gap. A sales leader sees a demo booked from a Google Ad and says, "Paid search is our best channel. Double the budget." What the data actually shows is that prospect first came into our world from a webinar six weeks ago. The ad didn't create the demand; it captured it. The webinar was the true driver.
To get a real picture of what’s working, B2B SaaS teams need to use the more sophisticated models available in platforms like HubSpot or Salesforce:
- •Linear Attribution: Spreads credit equally across every single touchpoint. It’s a good starting point to see the whole journey.
- •Time-Decay Attribution: Gives more credit to the touchpoints that happened closer to the conversion. This acknowledges that recent interactions probably had a bigger influence.
- •U-Shaped (Position-Based) Attribution: My personal favorite for a balanced view. It assigns 40% of the credit to the very first touch, 40% to the final lead-creation touch, and divides the remaining 20% across all the interactions in between.
Adopting one of these models helps you finally justify the investment in top-of-funnel content—the stuff that builds your brand but doesn't immediately spit out a sales-ready lead.
Building Your Revenue Dashboard
Your CRM needs to be your command center, your single source of truth—not just a glorified digital Rolodex. The goal is a dashboard that ties every campaign activity directly to pipeline and revenue. This is how you get real-time visibility into what’s actually moving the needle.
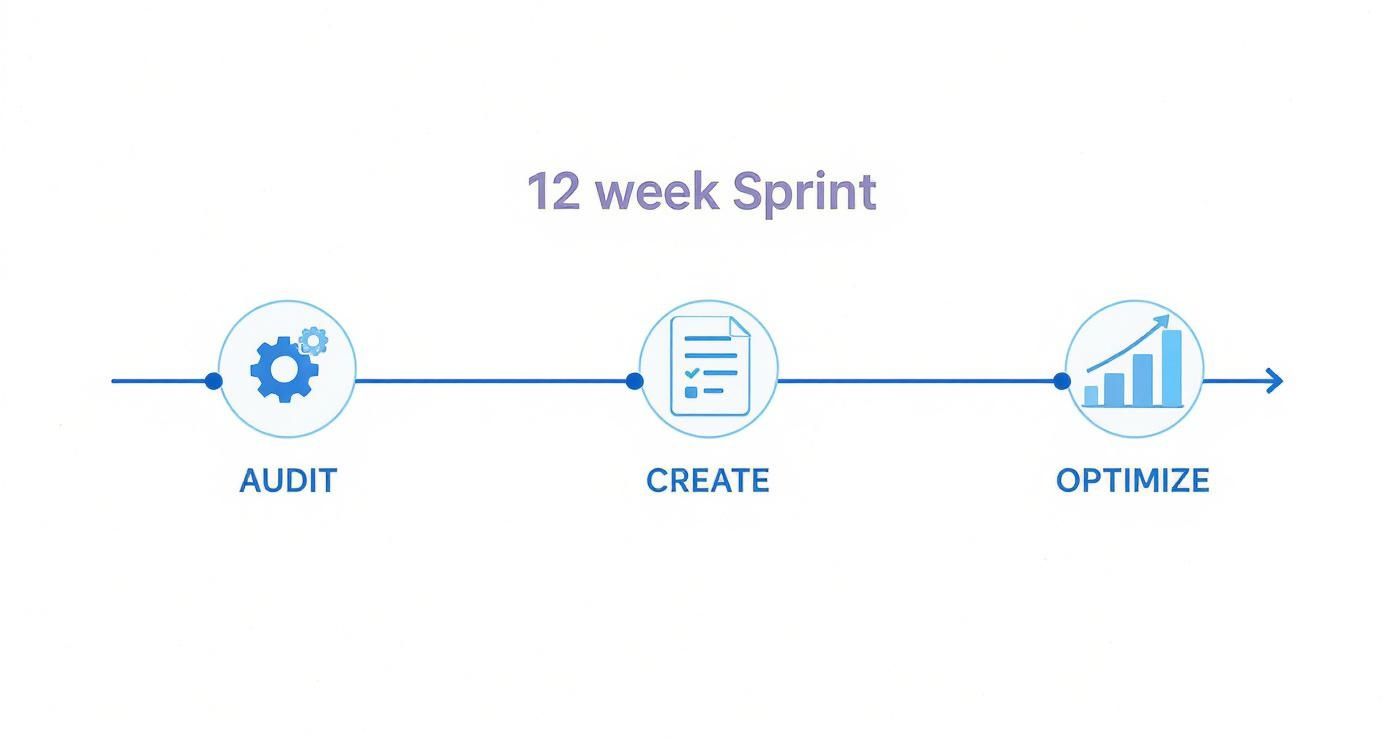
A 12-week sprint timeline showing three stages: Audit, Create, and Optimize with icons.
This kind of visualization is critical. It moves you past vanity metrics and draws a direct line from a marketing campaign to the pipeline it influenced. Your dashboard shouldn't just be a data dump; it has to be a decision-making tool that tells you where to double down and where to pull back.
The KPIs That Truly Matter
Stop obsessing over MQL volume or website traffic. Those are vanity metrics. It's time to focus on the numbers that have a direct line to the company's P&L. These are the KPIs that prove your demand gen engine is creating predictable growth, not just noise.
- •Pipeline Velocity: How fast are deals moving through your sales funnel? A healthy demand gen program attracts educated buyers who already "get it," which should speed things up. A good target here is a 15–25% improvement within two quarters.
- •Customer Acquisition Cost (CAC): Simple but powerful: how much does it cost to land a new customer? Great demand generation lowers your CAC over time by driving more organic and direct traffic from people who already know, like, and trust you.
- •Sales Cycle Length: How long does it take to close a deal, on average? As you build brand authority and educate your market, this number should go down. Prospects show up to the first sales call already sold on the value.
- •Marketing-Sourced Pipeline: What percentage of the total sales pipeline came from marketing's efforts? This is the ultimate metric that proves marketing’s contribution to the bottom line.
This timeline shows how a structured sprint moves from a foundational audit to optimization, ensuring that measurement is built-in from day one, not bolted on as an afterthought.
By focusing on these core metrics, you transform marketing from a cost center into a predictable, scalable revenue driver. It's the only way to stop wasting budget and start scaling demand generation with confidence.
Common Demand Generation Questions Answered
We get it. Moving away from the old lead-centric model and embracing a true demand generation strategy brings up a lot of questions. Here are the no-nonsense answers to the ones we hear most often from B2B SaaS and Fintech leaders.
What Is the Difference Between Demand Generation and Lead Generation?
Think of it like this: demand generation is the entire season, while lead generation is the final scoring drive.
Demand generation is a full-funnel strategy. Its job is to build awareness and create a genuine desire for your solution across your entire target market. You're educating, building authority, and earning trust, so when a prospect's problem becomes urgent, your brand is the only one they consider.
Lead generation, on the other hand, is a specific, bottom-of-funnel tactic. It's focused purely on capturing contact info from people who are already raising their hands. Demand generation creates the interest that lead generation eventually captures.
How Long Until We See Results from a Demand Generation Program?
This isn't an overnight fix, and anyone who tells you otherwise is selling something. While you can spot early indicators—like better website engagement or more branded search queries—within 6 to 8 weeks, the real, measurable revenue impact of a demand gen strategy typically takes 6 to 12 months to show up in the pipeline.
Why? Because you're playing the long game. You're building brand affinity, educating an entire market, and becoming the go-to authority. That doesn't happen with a single campaign.
A key leading indicator we always tell clients to watch for is a drop in the sales cycle length for inbound leads. When prospects show up to the first call already educated, sold on the problem, and asking about your solution, you know your top-of-funnel content is hitting the mark. This often happens months before you see a huge spike in pipeline value.
What Are the Most Important Demand Generation Metrics to Track?
It's time to graduate from vanity metrics like MQLs and content downloads. To prove your demand engine is actually working, you need to track metrics that have a direct line to revenue.
- •Pipeline Velocity: How quickly are deals moving from the first touch to a closed-won? An effective demand program shortens this by bringing in more educated, high-intent buyers who are ready to talk specifics.
- •Sales Cycle Length: Is your content helping prospects make decisions faster? This metric is direct proof that you're removing friction from their buying journey.
- •Customer Acquisition Cost (CAC) to Lifetime Value (LTV) Ratio: Is your growth actually profitable? True demand gen lowers your CAC over time by increasing the flow of inbound and organic interest, which is far more efficient than paid channels.
- •Marketing-Sourced Pipeline Percentage: What slice of the sales pipeline can be directly tied to marketing's efforts? This is the ultimate proof of marketing's contribution to the bottom line and the number your CFO really cares about.
These are the numbers that reveal the true health and efficiency of your entire Go-to-Market engine, not just the activity level of your marketing team.
Can a Small Startup Team Effectively Implement Demand Generation?
Absolutely. In fact, a small, focused team often has an edge. The key is to resist the temptation to do everything at once. A scattered, low-quality approach will burn you out and get you nowhere.
Instead, you need to be ruthless.
Start by getting hyper-specific about one Ideal Customer Profile (ICP). Then, create one incredibly high-value "pillar" piece of content that solves a massive, painful problem for them. Finally, pour 100% of your energy into distributing and repurposing that single asset across the two or three channels where your ICP actually spends their time. A focused, high-quality approach always beats a scattered, mediocre one.
Ready to stop guessing and start building a predictable revenue engine? The Altior & Co. 6-Week Revenue Growth Sprint applies this exact playbook to your business, uncovering the hidden gaps between perception and reality in your funnel and delivering a clear blueprint for scalable growth. You can expect to see a 15–25% improvement in pipeline velocity within the first 6 weeks. Learn how the 6-Week Revenue Growth Sprint can deliver measurable outcomes for your business.