Stop guessing and start growing. Our data-driven guide shows you how to find and fix revenue leaks in your B2B SaaS or fintech company for good.
You've got that nagging feeling, don't you? Your dashboards might look green, but you know your revenue engine isn’t firing on all cylinders.
That feeling is real. It’s the gap between what your team reports and what the data proves—a gap where millions in ARR get lost, not in big, dramatic failures, but in a thousand tiny operational cuts. To truly fix revenue leaks, you have to stop guessing and start diagnosing with cold, hard data.
Your Revenue Is Leaking, and You Don't See It
Revenue leaks are the silent killers of growth for B2B SaaS and fintech companies. They aren't big, explosive events; they're the slow, quiet drain from broken processes, delayed lead follow-ups, and messy CRM data. This isn't about telling your team to work harder. It's about building systems that show you what’s really happening on the ground.

A businessman works intently on a laptop at a desk with scattered coins, beside a 'Stop Revenue Leaks' sign.
Here’s a classic example we see all the time: a sales leader reports 90% follow-up compliance on MQLs. But when you pull the raw CRM data and look at time-stamped activities, the truth is closer to 30%. That 60% gap? That’s where your profit evaporates.
"The biggest source of lost revenue isn't the deals you lose; it's the deals you never even get to compete for because of process failures," notes Jason Lemkin, founder of SaaStr.
The Widening Gap Between Activity and Results
This disconnect isn't just an internal problem; it mirrors broader market trends. A recent S&P Global analysis showed a 75% surge in M&A deal values in the Middle East and Africa, yet the total number of transactions actually declined.
This is a classic revenue leak pattern. Big, flashy wins can easily mask a deteriorating pipeline and falling operational efficiency. While you're celebrating the whale, dozens of smaller, high-potential deals are slipping through the cracks due to internal friction.
Before you can plug the holes, you need to know where to look. Most of the damage happens in the same few places.
Common Revenue Leaks You Are Overlooking
This table breaks down the most common—and costly—leaks we find in B2B SaaS and fintech companies, along with the symptoms they produce. Do any of these feel familiar in your business?
| Leak Source | Common Symptom | Potential Business Impact |
|---|---|---|
| Slow Lead Handoffs | High MQL-to-SQL conversion decay; reps complain about "stale" leads. | Wasted marketing spend; lower sales pipeline velocity. |
| Inconsistent Follow-up | Promising conversations go cold after the first or second touchpoint. | Lost deals to competitors; shrinking pipeline coverage. |
| Poor Data Hygiene | Inaccurate forecasts; inability to segment customers or track attribution. | Misallocated resources; inability to double down on what works. |
| No Lead Routing SLA | Leads sit unassigned in the CRM for hours or even days. | 50%+ drop in conversion probability after the first hour. |
| Customer Churn | Unexpected cancellations; low Net Revenue Retention (NRR). | Reduced Customer Lifetime Value (CLV); higher acquisition costs. |
That last one, churn, is often the biggest leak of all. A 5% increase in customer retention can increase profitability by 25% to 95%, according to research from Bain & Company. For a deeper dive, this guide on understanding churn in SaaS is a great resource.
The good news? These leaks are fixable. But you need a plan. This guide is your diagnostic framework. We'll walk through the exact steps to identify the leaks, quantify their financial impact, and systematically fix the underlying issues in your go-to-market motion. Let's turn that hidden friction into predictable growth.
The Diagnostic Toolkit to Quantify Your Leaks
You can't fix what you can't measure. Forget the vanity metrics that look good in a board deck; before you touch a single process or retrain a single rep, you need a baseline of cold, hard truth.
This is about digging into the five numbers that expose the unfiltered reality of your go-to-market performance.

A person reviews financial charts in a spiral notebook and on a laptop, with an 'AUDIT TOOLKIT' overlay.
To properly diagnose and fix revenue leaks, you need to ignore the noise—impressions, follower counts, all of it—and focus solely on the metrics that track money moving through your funnel.
This becomes especially critical in a tougher economic climate. With the World Bank’s regional economic update lowering the MENA growth forecast to just 2.7% in 2025, the pressure is on. For B2B SaaS companies, that pressure shows up as longer sales cycles and shrinking deal flow.
In this environment, operational excellence isn't a nice-to-have; it's your biggest competitive advantage.
The Five Core Metrics That Matter
All the answers you need are hiding in your CRM, even if it's a mess. We’re going to pull the data for five specific KPIs that reveal the true health of your revenue engine. These are the numbers that show you exactly where deals are stalling, dropping off, or just plain dying.
- •Lead-to-Opportunity Conversion Rate: What percentage of MQLs actually become qualified pipeline? This is the first and most crucial handoff.
- •True Pipeline Coverage: Are you sitting on a healthy 3.5x your quarterly target, or a dangerous 1.5x? This number tells you if you even have enough fuel in the tank.
- •Average Lead Response Time: How many hours—or days—does it take for a rep to make the first meaningful contact with a new lead?
- •Average Sales Cycle Length: From creation to close-won, how many days does a deal take to get across the finish line?
- •Sales Follow-up Rate: What percentage of your open opportunities received a follow-up activity within the last 7 days?
Forget complex dashboards for a moment. If you can confidently report on just these five metrics, you are already ahead of 80% of your peers. This is the foundation of any real RevOps function.
From Data Points to Dollar Impact
Pulling these numbers is just step one. The real magic happens when you attach a dollar value to the gaps you find. This is how you transform a technical problem ("our lead response time is 12 hours") into a compelling business case ("that 12-hour delay is costing us €250,000 in lost pipeline every single quarter").
It’s not guesswork. We know from industry data across sources like Salesforce and HubSpot that responding to a lead in under two hours versus 24 hours can boost qualification rates by over 50%. Once you know your average deal size and MQL volume, you can calculate the direct financial cost of that delay. It's simple, powerful math.
This is how you get buy-in from leadership to invest in fixing the processes and systems that plug the leaks for good. Quantifying the problem removes all the subjectivity and focuses the conversation on ROI.
To help you get started, we built a tool to attach real numbers to these operational gaps. Use our free revenue leak calculator to see how small, achievable improvements in these core metrics translate into significant ARR growth. This isn't just about finding problems; it's about building a data-backed roadmap to a more predictable and profitable revenue engine.
Tracing Leaks Back to Their Root Cause
Pinpointing a slow lead response time or a leaky conversion rate is a great start, but it’s like knowing you have a fever without knowing what infection is causing it. Poor metrics are symptoms, not the disease. To permanently fix revenue leaks, you have to push past the ‘what’ and aggressively diagnose the ‘why’.
This is where so many revenue leaders get stuck. They see the problem—a 48-hour lead response time, for instance—and their first instinct is to tell the sales team to "be faster." But that’s just slapping a bandage on the symptom. The real issue is almost always buried deeper in your processes, technology, or team alignment.
Without a proper root cause analysis, you'll find yourself fighting the same fires every single quarter. The leak will just keep popping up, maybe in a slightly different spot, but it’ll still be there.
The ‘5 Whys’ Framework for Your Funnel
To really get to the heart of the matter, you need a simple but incredibly powerful diagnostic tool. The ‘5 Whys’ technique, originally developed by Toyota for manufacturing, is perfectly suited for deconstructing a broken revenue process. It’s a forcing function that makes you look past the surface-level problem to uncover the systemic failure hiding underneath.
Let's walk through a classic revenue leak: high-intent MQLs are going stale before sales can follow up.
- •Why #1: Why aren't leads getting a follow-up? Because they aren't being assigned to a rep in time.
- •Why #2: Why aren't they being assigned correctly? Because they’re getting stuck in a CRM queue with no owner.
- •Why #3: Why are they getting stuck in that queue? Because our automated lead routing rule is failing for certain lead sources.
- •Why #4: Why is that routing rule failing? Because a new field was added to our web form, and the CRM logic was never updated to handle it.
- •Why #5: Why wasn't the logic updated? Because there’s no designated owner for maintaining lead routing rules, and no process for testing them after a marketing change.
All of a sudden, the problem isn't "slow reps." The root cause is a glaring process and ownership gap. Telling reps to speed up would have accomplished nothing. The real fix is to assign clear ownership of the lead routing system and build a simple pre-launch checklist for any changes to your lead capture process. This diagnostic mindset is the core of effective funnel optimization.
Is It a Process, Tech, or People Problem?
Nearly every revenue leak you'll find can be traced back to a breakdown in one of three areas. Figuring out which category your problem falls into is the key to choosing the right solution. You don’t want to be buying new software when what you really need is a clear Service Level Agreement (SLA).
A common mistake is blaming underperforming technology for what is actually a broken process. As a wise RevOps leader once said, “Automation applied to an inefficient operation will magnify the inefficiency.”
To help you diagnose the source of a breakdown, you need a simple way to map symptoms to their likely causes. This is exactly what the framework below is designed for.
Root Cause Analysis Framework
This table maps common revenue leak symptoms to their most likely root causes across process, technology, and people.
| Symptom (The 'What') | Potential Process Cause | Potential Technology Cause | Potential People/Alignment Cause |
|---|---|---|---|
| High Lead Response Time | No defined SLA between marketing and sales for lead follow-up. | Lead routing rules are broken or non-existent in the CRM. | Sales reps manually cherry-pick leads instead of following a first-in, first-out system. |
| Low MQL-to-SQL Rate | The MQL definition is too broad and includes low-intent activities. | Lead scoring model is poorly configured and misidentifies priority leads. | Sales doesn’t trust marketing’s leads and therefore de-prioritizes them. |
| Inaccurate Pipeline Forecast | No mandatory fields or deal stages in the sales process. | The CRM lacks automation to flag stale or at-risk deals. | Reps are not trained on how to properly manage their pipeline stages. |
| Long Sales Cycle | No formal qualification checklist to disqualify poor-fit leads early. | Lack of integrated sales enablement tools (e.g., contract software). | No incentive for reps to close deals efficiently; compensation rewards pipeline size over velocity. |
By mapping the symptoms you quantified earlier to this framework, you get a clear, actionable target for your remediation efforts. You’re no longer guessing; you’re operating with a precise diagnosis. This clarity is the foundation for building a prioritized roadmap to fix the leaks for good.
Building Your Prioritized Roadmap for Fixing Leaks
You’ve done the hard diagnostic work. You have a list of quantified revenue leaks and you’ve traced them back to their root causes—broken processes, messy data, or misaligned teams. So, now what? The temptation is to try and fix everything at once, but that’s a recipe for chaos and burnout.
The next step is to move from analysis to action by building a practical, prioritized roadmap. This isn't about creating a massive project plan that sits in a folder. It's about building a concrete Revenue Growth Blueprint that focuses your energy on the fixes that will deliver the biggest impact in the shortest amount of time.
The Impact vs. Effort Prioritization Framework
To do this effectively, you need a simple framework. Every potential fix should be scored against two critical factors:
- •Potential Revenue Impact: How much ARR could this fix realistically unlock or protect? This is where your earlier quantification work pays off.
- •Implementation Effort: How much time, resources, and political capital will it take to get this done?
Plotting each fix on an Impact vs. Effort matrix immediately clarifies your priorities. You're looking for the quick wins—the low-effort, high-impact fixes that build momentum and fund the bigger projects.
For example, implementing a simple round-robin lead routing rule with a two-hour SLA is a classic quick win. It’s a low-effort technical change that can boost lead conversion rates by 10-15% within a single month. In contrast, a full-scale CRM data clean-up is a high-effort, high-impact project with a longer-term payoff. Both are important, but the lead routing fix delivers value now.
Your goal is to create a sequence of fixes that delivers compounding returns. Early wins build credibility and buy-in for the more complex, foundational projects that will follow.
To move from symptom to solution, it helps to visualize the diagnostic process.
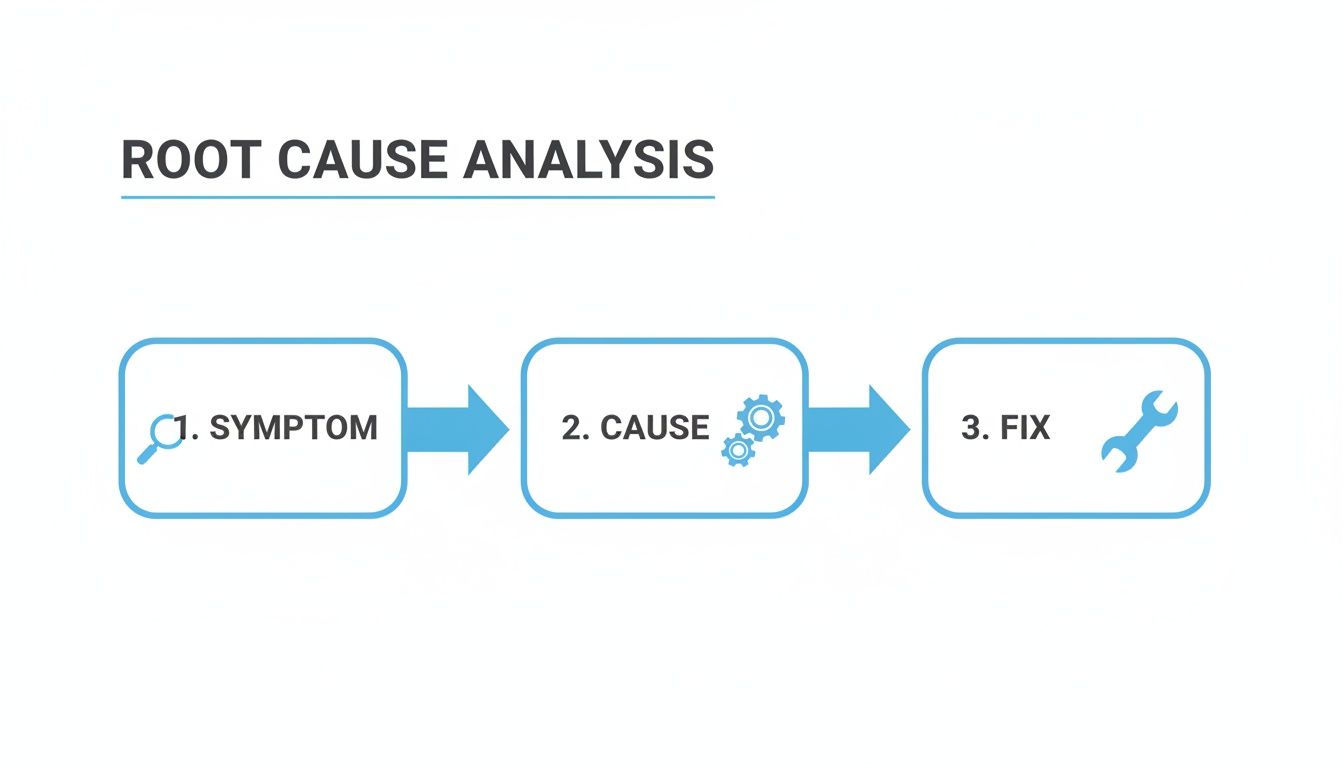
A root cause analysis diagram illustrating three steps: symptom identification, cause analysis, and problem fixing.
This simple flow—from symptom to cause to fix—is the engine of your roadmap, ensuring every action is tied to a specific, diagnosed problem.
Mapping Out Your Revenue Growth Blueprint
Once you’ve prioritized your fixes, it's time to build your action plan. This blueprint transforms your audit from a static report into a living document that drives execution. For each initiative, you absolutely must define the following:
- •The Fix: A clear, one-sentence description of the action. (e.g., "Implement an SLA for all inbound MQLs.")
- •The Owner: Who is the single person accountable for getting this done? No committees.
- •The Timeline: A realistic deadline for implementation.
- •Success Metrics: How will you know you’ve succeeded? (e.g., "Reduce average lead response time from 24 hours to under 2 hours.")
- •Estimated ROI: What is the expected financial impact on pipeline or ARR?
This structure creates the clarity and accountability essential for making progress. Without it, good intentions quickly fade in the face of daily pressures. Understanding your numbers is the bedrock of this process; our guide to mastering revenue analytics provides a deeper dive into the metrics that power these decisions.
The need to plug internal leaks becomes even more urgent when you consider external market trends. The MEA leak detection market research projects the market will grow from $208 million in 2024 to $308 million by 2030. This massive investment shows a huge market opportunity, yet many sales organizations fail to capitalize because of internal failures like slow lead qualification and poor sales cycle management. It highlights the staggering cost of not fixing your internal engine when the market is expanding.
By building a prioritized roadmap, you ensure your resources are focused on capturing this opportunity, not squandering it through operational friction.
Real-World Fixes and Their Measurable Impact
Theory is great, but let's be honest—it’s seeing how these fixes actually play out in the real world that matters. It’s one thing to diagnose a problem, but it’s another to apply a fix that translates into measurable growth for a B2B SaaS or fintech company just like yours.
These aren't just abstract stories. They're quick, practical examples of how targeted interventions in your revenue operations can produce significant, predictable results. Think of them as mini-case studies that draw a straight line from a specific operational fix to a tangible business outcome.
Case Study 1: The Clogged Pipeline
Company X, a growing fintech platform, was wrestling with a classic problem: their sales cycle was painfully long. A quick dive into their CRM data showed it was averaging 92 days, way above the industry benchmark for their deal size. Reps were spending weeks chasing leads that were never going to close, stretching resources thin and bloating the pipeline with low-quality opportunities.
The root cause wasn’t the sales team's closing ability. It was a complete lack of upfront qualification. Leads were just tossed over the fence from marketing to sales after a single form submission, with no real process to figure out if they were a good fit or had any actual intent.
The Fix:
- •Process First: A mandatory, non-negotiable qualification checklist was built directly into their CRM. Reps simply could not move a deal to the "Discovery" stage without completing fields for budget, authority, need, and timeline (BANT).
- •Tech Enforcement: The CRM was configured to enforce this rule systemically. No manual overrides, no exceptions.
- •Team Alignment: Sales and marketing got together to redefine the MQL-to-SQL handoff. This crucial step shifted marketing’s focus from just hitting a volume number to delivering quality leads that had a real shot at closing.
The Measurable Impact:
The impact was clear within a single quarter. By stopping unqualified leads from ever entering the active pipeline, the team could focus all their energy on high-potential deals. Their average sales cycle plummeted from 92 days to just 65 days—a 29% improvement in pipeline velocity.
Case Study 2: The Silent Treatment
Company Y, a B2B SaaS provider, had a totally different kind of leak. They were generating a healthy volume of free trial sign-ups, but their trial-to-paid conversion rate was stuck at a dismal 11%. An audit of their CRM activity data uncovered the shocking truth: nearly 40% of trial users received zero follow-up from the sales team after the initial welcome email.
Reps were swamped. They were cherry-picking what they thought were the "best" leads and letting the rest go cold. It was a massive, self-inflicted revenue leak caused by a simple lack of process and automation.
The Fix:
- •Define the Process: A simple, three-touch follow-up sequence became the minimum standard for every new trial. This Service Level Agreement (SLA) was clearly communicated and agreed upon by the entire sales team.
- •Automate It: Instead of hoping reps would remember, they implemented an automated email sequence. These emails triggered directly from the CRM, sending on behalf of the assigned sales rep on days 2, 5, and 10 of the trial, prompting users to book a demo or ask questions.
- •Align Incentives: The sales compensation plan was tweaked to include a small bonus for SLA adherence, directly linking process compliance with a reward.
The Measurable Impact:
The results were almost immediate. By ensuring every single trial user received consistent, timely follow-up, no lead was left behind. In just six weeks, Company Y increased their trial-to-paid conversion from 11% to 17%. This single fix added over €200,000 in new ARR in the first quarter alone.
For a deeper look at how systems like this are built, check out our guide on essential automation workflows for RevOps.
These examples show you don't need a massive, multi-year transformation project to fix revenue leaks. Often, the most powerful fixes are simple, targeted changes to a single broken process, enforced by your existing technology.
Building a Leak-Proof Revenue Engine for the Future
Fixing today’s revenue leaks is a great start. But the real win? Building a system that stops them from coming back.
Your goal isn't just a one-time repair job. It’s about building a culture of revenue accountability where performance is totally visible and feedback loops are instant. This is how you finally shift out of reactive, fire-fighting mode and into a proactive, performance-driven operation.
And the foundation for all of it is a single, shared source of truth.
The Weekly RevOps Dashboard
Forget about those dense reports with dozens of metrics nobody looks at. To keep your engine leak-proof, you need one simple, weekly RevOps dashboard that everyone lives in. It should track the five core metrics we've been focused on:
- •Lead-to-opportunity conversion rates
- •True pipeline coverage
- •Average lead response time
- •Sales cycle length
- •Sales follow-up rates
This dashboard can't be some secret document held by leadership. It needs to be visible to the entire go-to-market team, from the newest BDR right up to the CRO. When everyone sees the same numbers, the conversation shifts from opinions to objective reality. That kind of transparency creates real accountability. A huge piece of this involves building a sales pipeline for steady revenue growth so these metrics stay healthy quarter after quarter.
Creating Proactive Feedback Loops
Once you have that shared visibility, the next move is to operationalize your new processes with automated feedback loops. This is where your systems start doing the heavy lifting, making sure standards are met without someone having to manually check all the time.
Think of it as embedding checks and balances directly into your team's weekly rhythm.
For example, when a new inbound lead sits unassigned for more than an hour, an automated alert should fire in a public Slack channel. This isn't about shaming anyone; it’s about making the process failure visible so it can be jumped on immediately.
This isn't micromanagement; it's system-driven accountability. You're not managing the people—you're managing the process and giving the team the data they need to self-correct.
Here's another one: when your pipeline coverage dips below that 3x target, an automated report can trigger a standing "pipeline huddle" between sales and marketing leaders. The agenda is dead simple: figure out why it dropped and agree on a plan to fix it. This kind of proactive teamwork stops small problems from turning into quarter-ending disasters.
By embedding these triggers and rhythms into your operations, you build a scalable, predictable growth machine. You no longer just fix revenue leaks after they've already happened—you create an engine designed to prevent them from ever starting.
This shift is the final, most important step in turning your revenue operations into a true competitive advantage.
Common Questions on Plugging Revenue Leaks
When we start digging into revenue operations with B2B SaaS and fintech founders, the same questions pop up time and again. Here’s what leaders at the €8–10M ARR stage are asking—and what our experience shows are the real answers.
What’s the Single Biggest Leak We Should Tackle First?
Hands down, the most common and costly leak we find is a combination of slow lead response and inconsistent follow-up. It's a classic growing pain. By the time you hit the €8–10M ARR mark, marketing is usually humming along, but the process of getting those hard-won leads into a salesperson's hands is often broken.
Without strict Service Level Agreements (SLAs) and automated routing, high-intent leads just sit in a CRM queue, their value decaying by the minute. Sometimes for hours, often for days. The data on this is painfully clear: the first hour is golden.
Expert Insight: An oft-cited study from the Harvard Business Review found that companies trying to contact a potential customer within an hour of an inquiry are nearly seven times more likely to have a meaningful conversation with a decision-maker. Wait any longer, and the odds plummet.
For companies at this growth stage, fixing this one handoff point almost always delivers the fastest and most significant lift in revenue.
How Long Until We Actually See a Difference from These Fixes?
You’ll see changes in your leading indicators almost immediately. For example, if you implement an automated round-robin for lead routing, your average response time will drop within 24 hours. That's a quick, satisfying win you can show the board.
But for the lagging indicators—the metrics that hit the bottom line—give it one business quarter. A realistic timeline is seeing a 15–25% improvement in pipeline velocity or a tangible lift in your lead-to-opportunity conversion rate within 6 to 8 weeks. The trick is to start with the low-effort, high-impact fixes. This builds momentum and proves the value of the whole initiative right out of the gate.
Honestly, Our CRM Data Is a Complete Mess. Where Do We Even Start?
This is the most common reason for not starting. Waiting for perfect data is a trap that leads to "analysis paralysis." While clean, reliable data is absolutely the end goal, you don't need it to get going. In fact, running an initial diagnostic is often what builds the business case to fund a proper data clean-up project.
Don't let perfect be the enemy of good here. Start with what you have and focus on just one or two core metrics you can pull with reasonable confidence.
A great place to begin is simply comparing the lead creation timestamp against the timestamp of the first meaningful sales activity (like the first call or email). This one calculation will give you a baseline for your average lead response time. It won't be flawless, but it will be directional enough to prove there's a problem and justify taking the next step.
Ready to stop guessing and start fixing? The Altior & Co. 6-Week Revenue Growth Sprint applies this framework to your business. We'll help you diagnose the leaks, build a prioritized roadmap, and deliver a measurable 15-25% improvement in pipeline velocity within 6 weeks. Learn how we can help you build a leak-proof revenue engine by visiting https://altiorco.com.