Revenue Intelligence unlocks predictable SaaS growth. Learn the core components, impact, and a practical roadmap.
Ever stared at a sales forecast, feeling a pit in your stomach because you just don't trust the numbers? You're not alone. Revenue Intelligence is the system that closes the gap between what you think is happening in your pipeline and what the data actually proves. It's how you turn scattered sales activity into a predictable revenue machine that scales.
Moving Past Guesswork in Your Revenue Engine
For most B2B SaaS and Fintech founders, the weekly forecast meeting can feel like a high-stakes guessing game. You're leaning on your sales team's updates and their gut feelings, but a nagging uncertainty hangs in the air. Are your reps really as busy as their calendars suggest? Are those big deals moving forward, or just collecting dust in the CRM?
This disconnect between perception and reality is exactly where revenue leaks happen. It's a costly blind spot. A recent Salesforce report found that sales teams see an average turnover of 18% annually. When a rep walks out the door, their deal context and pipeline knowledge often go with them, creating huge gaps that gut feelings can't possibly fill. Revenue Intelligence is built to solve this exact problem.
The Disconnect Between Belief and Data
The gap between what leaders believe is happening and what the data shows can be staggering. Sales leaders often report 80% follow-up compliance on inbound leads, but a quick dive into the CRM data frequently reveals the actual number is closer to 25%. These are the kinds of expensive assumptions that silently kill growth.
"Revenue intelligence platforms have become essential for go-to-market teams that are looking to transform data into actionable insights.” — Michelle Morgan, Research Manager, Sales Force Productivity and Performance at IDC
This isn't about your team slacking off; it's about a fundamental lack of visibility. When you can't unify and analyze every single touchpoint—every call, email, and meeting—you're operating with an incomplete picture. And you can't fix what you can't see.
This guide gives you a clear framework for building a Revenue Intelligence system that pulls your organization out of unreliable forecasts and reactive fire-fighting. We'll break down the core components, show you how to measure the impact, and lay out a step-by-step plan to finally get control over your revenue engine. By connecting your systems with intelligent automation, you can amplify the truth that’s already hidden in your data. You can learn more about where to begin with AI-powered revenue operations in our detailed article. This isn't just about fancier dashboards; it’s about creating a systematic, data-driven culture that fuels predictable growth and gets rid of the costly "I think" from your vocabulary for good.
The Five Pillars of Revenue Intelligence
To really get a handle on Revenue Intelligence, you have to look past the buzzwords and break it down into a framework you can actually use. Think of it like building a high-performance engine designed for one thing: accelerating revenue. Every component is critical, and they all have to work together perfectly to create a powerful, predictable growth machine for your business.
This model cuts through the noise, turning an abstract concept into five tangible pillars you can build on.
This diagram shows how a proper Revenue Intelligence system connects your forecasts, pipeline, and teams into one unified, intelligent loop.

Revenue Intelligence system diagram showing connections between search, forecasts, pipeline, analytics and automation features
As you can see, a strong RI system doesn't just spit out reports. It creates a feedback loop that constantly refines your forecasts and sharpens your team's performance based on what's actually happening in the pipeline.
To make this crystal clear, let's look at the five core components of a successful Revenue Intelligence system. Each pillar builds on the last, turning raw data into predictable revenue.
The Five Pillars Of Revenue Intelligence
| Pillar | Core Function | Key Question It Answers |
|---|---|---|
| 1. Data Architecture | Integrates and cleans data from all GTM tools into a single source of truth. | "Is our data clean, connected, and trustworthy?" |
| 2. Advanced Analytics | Measures and diagnoses performance across the entire revenue funnel. | "What happened, and more importantly, why did it happen?" |
| 3. Actionable Signals | Provides real-time alerts on risks and opportunities in the pipeline. | "What needs my immediate attention right now?" |
| 4. AI-Powered Insights | Uncovers hidden patterns and prescribes the next best actions. | "What proven actions will improve our win rates?" |
| 5. Workflow Automation | Turns insights into consistent, automated actions and processes. | "How can we make sure the right things happen every time?" |
Let’s dig into what each of these pillars looks like in practice.
Pillar 1: Data Architecture – The Chassis
Everything begins with your data architecture. This is the strong, unified chassis of your revenue vehicle—the foundation that supports everything else. Without a solid structure, any insights you try to build on top will be wobbly and unreliable.
This pillar is all about integrating data from every go-to-market tool you use: your CRM, marketing automation platform, sales engagement tools, and even your finance systems. The goal is to create a single source of truth where every customer-facing activity is captured, cleaned, and organized. This is a non-negotiable part of effective Revenue Operations, ensuring every analysis is built on solid ground.
Pillar 2: Advanced Analytics – The Engine
Once your data is unified, the analytics layer acts as the engine, turning all that raw data into diagnostic horsepower. This is where you graduate from simple dashboards that show what happened and start diagnosing why it happened.
Advanced analytics lets you measure critical metrics with precision—things like pipeline velocity, stage-by-stage conversion rates, and sales cycle length. It’s the engine that powers your ability to spot bottlenecks, understand deal health, and forecast with real confidence. For example, instead of just seeing that Q2 revenue was low, you can pinpoint that deals stalled for an average of 22 days in the negotiation stage. Now you have a clear problem to solve.
Pillar 3: Actionable Signals – The Dashboard Alerts
Think of actionable signals as the real-time alerts flashing on your vehicle's dashboard. They're your early-warning system, flagging both risks and opportunities before they blow up into major problems. A deal with zero activity for two weeks? You get an alert. A key champion leaves an account? The system notifies you.
These signals are what make proactive management possible. They turn passive data into active intelligence, prompting your team to take specific actions that keep deals moving forward and prevent revenue from slipping through the cracks.
Pillar 4: AI-Powered Insights – The GPS Navigator
If analytics tells you what happened and signals tell you what’s happening now, then AI-powered insights act as your GPS navigator, showing you the best route to your destination. This pillar uses artificial intelligence and machine learning to analyze massive datasets and spot patterns a human analyst could never see.
AI-powered insights move beyond description to prescription. It can identify the specific behaviors of your top-performing reps that correlate with closed-won deals, revealing a repeatable playbook for success.
For instance, an AI might find that deals including a technical demo within the first 14 days have a 35% higher win rate. That's not just an interesting stat; it's strategic guidance that helps you refine your sales process and coach your team based on hard evidence, not just gut feel.
Pillar 5: Workflow Automation – The Cruise Control
Finally, workflow automation is the cruise control that turns all these brilliant insights into consistent, scalable actions. It’s what ensures the right processes are followed every single time, without relying on someone remembering to do it manually.
When a high-value lead comes in, automation can route it to the best rep instantly. When a deal is flagged as at-risk, a workflow can trigger a task for the manager to step in and review it. This pillar operationalizes your entire strategy, ensuring insights don’t just sit in a dashboard but are translated directly into how your team behaves.
Together, these five pillars form a complete Revenue Intelligence system that gives you the visibility, predictability, and control needed to truly master your revenue engine.
The Real-World Impact on Your Bottom Line
Okay, understanding the five pillars is one thing. But how does all this theory actually make you more money? That's what really matters. A well-oiled Revenue Intelligence system isn't about feeling more organized; it's about seeing specific, measurable changes in your company's growth and profitability.
Let's connect the dots and move past the buzzwords. Each piece of the RevIntel framework you build directly powers a business outcome, turning your investment into predictable returns.
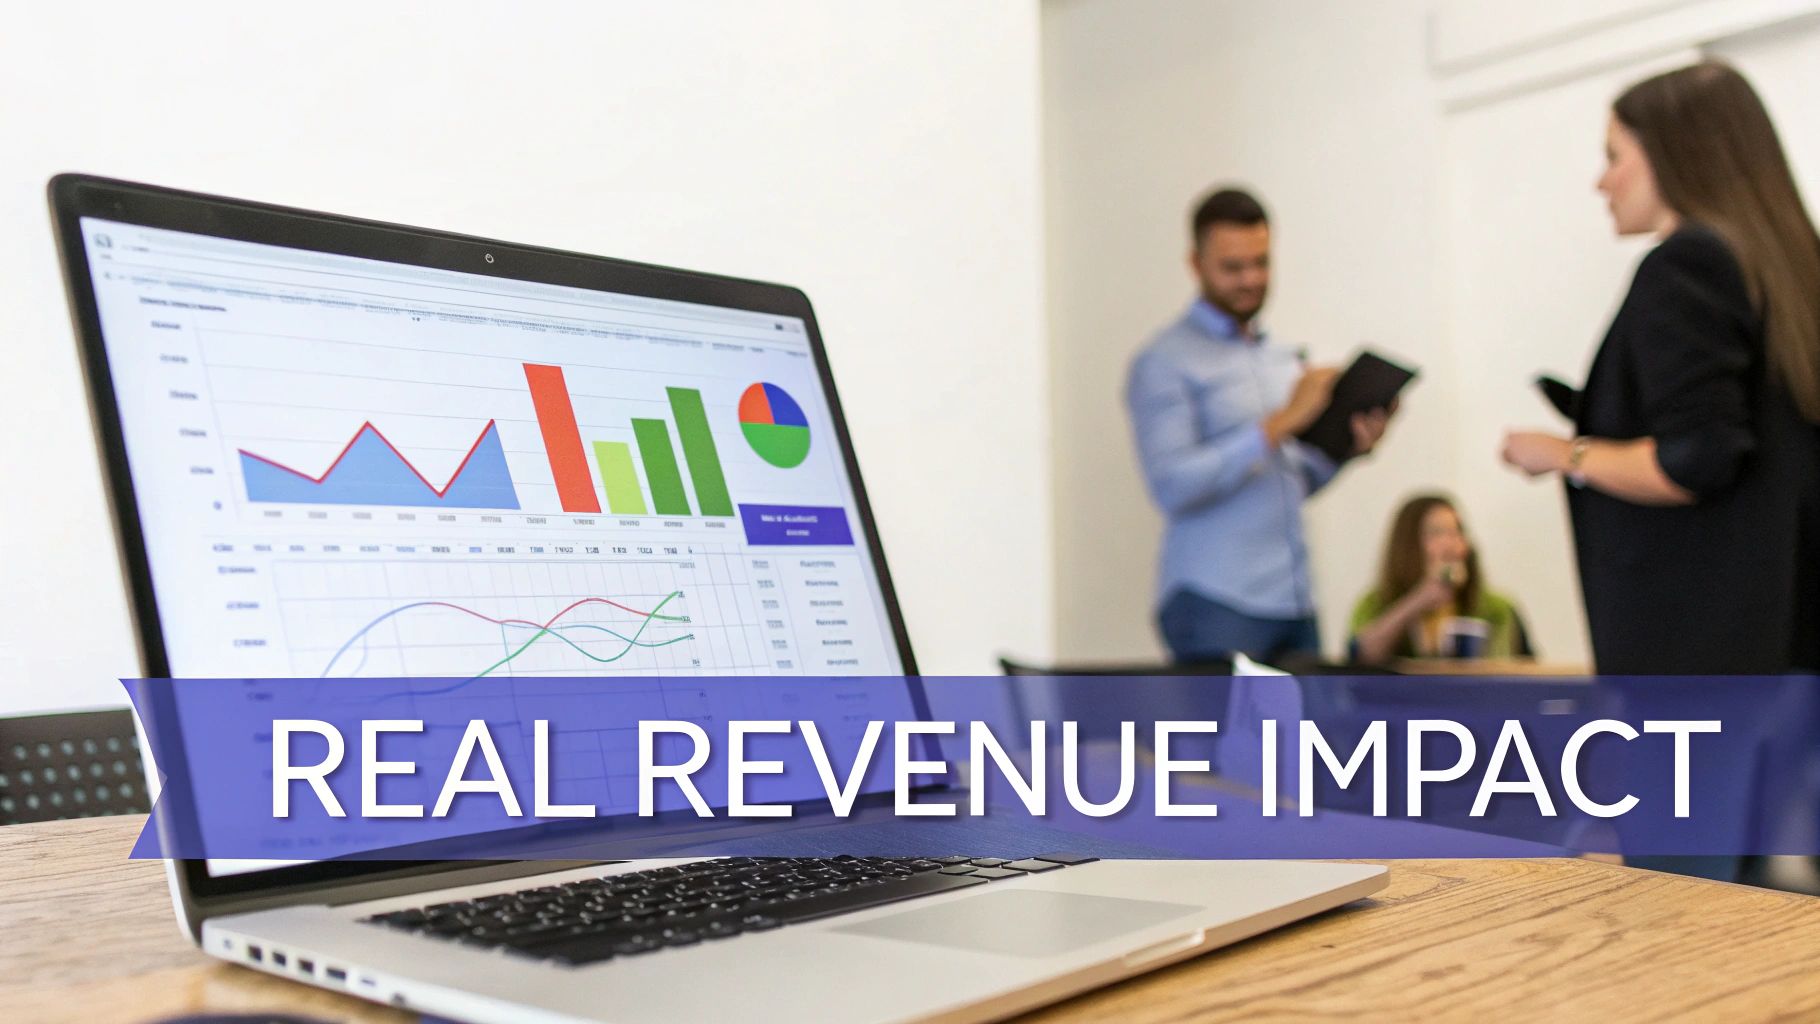
Laptop displaying colorful revenue analytics charts and graphs during business team meeting presentation
This is about watching the numbers on your financial statements go up and to the right.
From Better Data to Shorter Sales Cycles
Everything starts with a clean Data Architecture. When your CRM, marketing platform, and sales engagement tools are all speaking the same language, the first thing you'll notice is your sales cycle getting shorter. Why? Because you eliminate the friction and blind spots that make deals stall.
Instead of reps wasting hours manually updating records or chasing down engagement data, they have a single source of truth at their fingertips. For example, we helped a SaaS client reduce their sales cycle from 90 to 45 days by implementing a unified data model. For a €4M ARR company, that kind of acceleration unlocks a significant amount of cash flow.
Achieving Over 95 Percent Forecast Accuracy
Your Advanced Analytics engine is what turns your sales forecast from a hopeful guess into a reliable financial plan. By analyzing historical trends and real-time pipeline activity, you can achieve forecast accuracy of over 95%. This isn't just an academic exercise—it's what allows you to confidently make decisions on hiring, resource allocation, and strategic bets.
"Forecast accuracy is the ultimate measure of a CRO's command of the business." — Jason Lemkin, Founder of SaaStr
A predictable forecast is the bedrock of a scalable business. It allows you to confidently tell your board not just what you plan to hit, but how you're going to hit it, backed by indisputable data.
Boosting Win Rates Through Intelligent Coaching
This is where AI-Powered Insights and Actionable Signals come together to create a powerful coaching loop. For instance, an analysis for a FinTech client showed that their trial-to-paid conversion rate jumped from 12% to 18% in just six weeks when reps mentioned a specific integration partner on the first demo call.
These insights get delivered as real-time alerts or post-call summaries, giving managers hyper-specific coaching points. Instead of generic advice, they can say, “On your last call, you missed the chance to address the competitor mention at the 12-minute mark. Here’s how our top rep handles that.” This targeted feedback is what directly boosts team-wide win rates by over 15% in a single quarter.
Increasing Net Revenue Retention with Automation
Finally, Workflow Automation is your secret weapon for driving expansion revenue and improving Net Revenue Retention (NRR). You can set up automated triggers based on customer usage data to proactively spot upsell and cross-sell opportunities. Think about an automated workflow that alerts a CSM the moment an account hits 90% of its user limit, teeing up a perfectly timed conversation about upgrading their plan.
This systematic approach ensures no opportunity gets missed. It also helps flag churn risks early, letting your team step in before it's too late. The global demand for these capabilities is exploding; the customer intelligence platform market in the Asia Pacific region alone is projected to hit USD 3,922.2 million by 2030, a clear signal of the massive shift toward data-driven GTM strategies. You can dig deeper into this trend in the Asia Pacific market.
Your Six-Week Implementation Sprint
Turning Revenue Intelligence from a buzzword into a reality doesn't require a year-long, budget-draining project. With a focused sprint, you can build the core pillars and start seeing real results in just six weeks. This isn't about boiling the ocean; it's about moving from data chaos to data clarity with a plan that delivers quick wins and builds momentum.
Think of this as a concrete, week-by-week roadmap that transforms abstract advice into specific actions for your team.
Weeks 1-2: Audit and Align
The first two weeks are all about laying a solid foundation. You can’t build a skyscraper on shaky ground, and you can’t build a reliable intelligence system on messy data. This phase is the most critical—and the one most companies rush through. Don't make that mistake.
Your main goal here is brutally simple: establish a single source of truth.
Key Activities:
- •Tech Stack Audit: Map out every single tool in your GTM stack. Your CRM, marketing automation, sales engagement platform—where does key customer data actually live? Be honest about the mess.
- •Data Hygiene Assessment: Run diagnostics on your CRM. How many duplicate records are lurking in there? Is lead source tracking a free-for-all? What percentage of contact data is missing?
- •Cross-Functional Alignment: Get Sales, Marketing, and Customer Success in a room. It's time to end the debate. What exactly is a Marketing Qualified Lead (MQL)? What are the concrete, non-negotiable criteria for a Sales Qualified Lead (SQL)? Define every stage in your sales pipeline so there’s no room for interpretation.
Success in this phase isn’t a new dashboard; it’s clarity and consensus. You should end Week 2 with a universally agreed-upon "data dictionary" and a prioritized backlog of data cleanup tasks.
This upfront alignment is your best defense against the "garbage in, garbage out" problem that tanks so many data initiatives. It ensures the insights you generate later are built on data everyone actually trusts.
Weeks 3-4: Consolidate and Visualize
With a clean foundation, you can finally start connecting your data sources and building the dashboards that give you real-time visibility. This phase is where you shift from fragmented spreadsheets to a centralized view of your entire revenue funnel.
This is where your team starts to see the first tangible wins that build excitement and buy-in.
Key Activities:
- •Integrate Key Data Sources: Connect your marketing automation and sales engagement tools directly into your CRM. The goal is to create one unified timeline showing every interaction a prospect has had with your company.
- •Build Foundational Dashboards: Start with just three core dashboards. Don't overcomplicate it.
- •Pipeline Health: Track deal velocity, stage-to-stage conversion rates, and average sales cycle length.
- •Lead Funnel Analysis: Monitor lead-to-opportunity conversion rates by source and campaign.
- •Sales Activity Performance: Measure what your reps are actually doing (calls, emails, meetings) and connect it to pipeline created and deals won.
- •Establish Baselines: The moment your dashboards are live, document your current performance for every key metric. This is the baseline you'll measure all future improvements against.
The objective here is to replace gut feelings with hard data. A sales leader no longer thinks the pipeline looks healthy; they can now see that deal velocity has slowed by 15% in the last month—a clear, actionable signal to investigate.
Weeks 5-6: Automate and Optimize
The final phase is where Revenue Intelligence truly comes alive. With your data consolidated and visualized, you can build the automated workflows and alerts that turn those insights into consistent, proactive actions. This is about making your system work for you.
Here, you operationalize your insights at scale.
Key Activities:
- •Set Up Real-Time Alerts: Create automated notifications for critical deal risks. A perfect example: trigger an alert to a sales manager if a deal over €20k has had zero activity for 10 days.
- •Implement Workflow Automation: Build simple workflows that enforce your best practices. A classic starting point is creating a round-robin lead assignment rule with a 2-hour SLA to guarantee no inbound lead ever goes cold again.
- •Introduce Conversation Intelligence: Start recording and transcribing sales calls with a tool like Gong or Chorus. Even analyzing a small sample can uncover powerful patterns, like common objections that need better talk tracks or competitor mentions that signal a shift in the market.
By the end of this sprint, you'll have a foundational Revenue Intelligence system that doesn't just show you what's happening but actively helps your team respond faster and more effectively. Following this plan puts a 15–25% improvement in pipeline velocity well within your reach.
Revenue Intelligence Implementation Sprint
Getting started requires a structured plan. The table below breaks down the six-week sprint into a clear, week-by-week action plan, outlining the key activities and how you'll measure success at each stage. This framework is designed to keep your team focused and ensure you're building a system that delivers value from day one.
| Phase (Weeks) | Key Activities | Success Metric |
|---|---|---|
| Weeks 1-2 | Audit the GTM tech stack. Assess CRM data quality. Hold alignment workshops to define MQL/SQL and sales stages. | A signed-off "data dictionary" with clear definitions and a prioritized data cleanup backlog. |
| Weeks 3-4 | Integrate primary data sources (e.g., Marketo to Salesforce). Build foundational dashboards for pipeline health, funnel, and sales activity. | Three core dashboards are live and populated with baseline performance data for all key metrics. |
| Weeks 5-6 | Set up automated alerts for deal risks. Implement lead routing workflows. Begin analysis of transcribed sales calls. | At least two critical alerts and one automation workflow are active. Initial insights from call analysis are shared. |
This sprint isn't just about installing software; it's about building a new operational muscle. By focusing on these core activities, you create a powerful foundation that will continue to deliver returns long after the initial six weeks are over.
Common Pitfalls and How to Sidestep Them
Adopting Revenue Intelligence is a powerful move, but it's not a magic wand. Like any strategic initiative, it comes with a few traps that can completely derail your progress before you see a single euro of return. Knowing what can go wrong is the first step to making sure everything goes right.
Being aware of these common failure points helps you sidestep them, ensuring your investment of time and resources translates directly into predictable growth—not just another set of dashboards nobody uses.

Business professional organizing colorful sticky notes on board while using laptop with analytics dashboard
The Garbage In, Garbage Out Trap
The single biggest reason Revenue Intelligence projects fail is embarrassingly simple: bad data. You just can’t build reliable insights on a foundation of messy, inconsistent, and untrustworthy CRM data. If your lead sources are a free-for-all and deal stages mean different things to different reps, any analysis you run will be fundamentally flawed from the start.
The accuracy of your insights is capped by the quality of your data. A flawed input guarantees a flawed output, no matter how sophisticated your tools are.
How to Sidestep It: Dedicate the first two weeks of your implementation sprint exclusively to data hygiene and alignment, just as we outlined in the roadmap. Get Sales, Marketing, and Success in a room to hammer out firm, non-negotiable definitions for every single stage of the customer journey. This upfront work isn’t optional; it’s the price of admission for building a system everyone actually trusts.
The Tool-Over-Strategy Mistake
It’s tempting to believe that buying a shiny, expensive piece of software will solve all your revenue problems. But here’s the reality: investing in a powerful platform without a clear strategy for how you'll use it is like buying a Formula 1 car without knowing how to drive. The tool itself is just an expensive paperweight without a well-defined process, clear goals, and team buy-in.
This is the mistake that leads to low adoption rates and a hefty subscription fee for a tool that ultimately becomes shelfware.
How to Sidestep It: Strategy comes first. Always. Before you even look at vendors, clearly define the top three business questions you need this system to answer. Are you trying to shorten your sales cycle? Improve forecast accuracy? Boost win rates? Let these specific goals dictate the features you need, not the other way around.
Analysis Paralysis
The final pitfall is drowning in a sea of data without taking any meaningful action. Modern Revenue Intelligence platforms can generate an overwhelming number of charts, reports, and alerts. When everything is a priority, nothing is. This leads directly to "analysis paralysis," where your team spends more time staring at dashboards than using the insights to change their behavior and improve outcomes.
This challenge is becoming more common globally as digital economies expand. In Southeast Asia, for instance, the digital economy is forecasted to surpass $300 billion in Gross Merchandise Value by 2025, driven by the adoption of data analytics tools. Without a focus on action, this explosion of data can hinder growth rather than help it. You can learn more by checking out the e-Conomy SEA report on bain.com.
How to Sidestep It: Focus on a handful of "trigger metrics." These are specific data points that, when they change, automatically trigger a specific action. For example: "If a deal has zero engagement for 10 days, the sales manager is automatically alerted to review the deal." This simple approach connects every insight directly to a concrete, actionable next step, turning data into decisive action.
Turning Revenue Insights into Action
We’ve spent this guide breaking down the engine of Revenue Intelligence, piece by piece. But if you walk away with only one thing, let it be this: Revenue Intelligence isn’t about collecting data; it’s about driving intelligent action. It’s the critical bridge between knowing what’s happening in your pipeline and making the decisive moves that create predictable growth.
From getting your data architecture clean to unleashing AI-powered signals and workflow automation, every pillar works in concert. The goal is to build a single source of truth that kills guesswork, aligns your entire go-to-market team, and transforms your revenue process from a black box into a clear, manageable system. The point isn’t more dashboards; it’s fewer, more impactful decisions.
From Insight to Impact
The entire framework is designed to produce one thing: a clear, measurable business outcome. When you put these principles into practice, your organization shifts from reactive fire-fighting to proactive, data-driven strategy. This is what empowers your teams to shorten sales cycles, nail their forecasts, and coach with absolute precision.
A successful Revenue Intelligence implementation isn't measured by the number of reports you generate, but by the speed and confidence with which your team acts on the insights they provide.
Achieving a 15–25% improvement in pipeline velocity within just six weeks is not just possible—it's a realistic goal. This isn’t some hypothetical number; it’s the direct result of plugging leaks, optimizing broken processes, and giving your team the visibility they need to win. To see more strategies on this, we break it down further in our guide on sustainable revenue growth.
Ready to stop guessing and start acting? Don't let valuable insights stay trapped in siloed systems.
See how our 6-Week Revenue Growth Sprint can apply this framework directly to your business.
Frequently Asked Questions
Even with a clear roadmap, jumping into a new strategic framework always brings up a few questions. Here are the straight answers to the most common ones we hear from SaaS and Fintech leaders looking at Revenue Intelligence.
What’s the Difference Between Revenue Intelligence and Business Intelligence?
Think of it like this: Business Intelligence (BI) is your rearview mirror. It’s fantastic for showing you what already happened—last quarter’s sales numbers, historical win rates, and regional performance. BI is descriptive; it’s brilliant at analyzing the past.
Revenue Intelligence (RI), on the other hand, is your car's GPS navigator combined with its forward-collision warning system. It doesn't just look at historical data; it analyzes real-time signals from your CRM, emails, and call recordings to tell you what's likely to happen next and what you should do about it. It’s forward-looking and prescriptive.
In short, BI answers, "What happened?" RI answers, "Which deals are at risk right now, and what's the next best action my rep should take to win?"
Do I Need a Dedicated RevOps Team to Get Started?
This is a common myth that holds too many companies back. While a mature Revenue Operations (RevOps) team can absolutely accelerate your progress, it’s not a prerequisite to get started. You don't need a full-blown department on day one.
The core principles of Revenue Intelligence are about process and alignment first, technology second.
You can make huge strides with a small, cross-functional "tiger team" of motivated people from sales, marketing, and operations. Empower this group to focus on the foundational steps from our six-week sprint: cleaning up data, aligning on definitions, and establishing that single source of truth. Starting small and banking quick wins is almost always more effective than waiting to build a big, dedicated team.
How Much Does a Revenue Intelligence Platform Cost?
The price tag on Revenue Intelligence software can range from a few hundred pounds a month to five or six-figure annual investments for enterprise platforms. But focusing only on the license fee is a strategic mistake.
The real question is, "What is the cost of inaction?"
Think about the financial hit from an inaccurate forecast, a leaky pipeline where good deals go dark, or the sky-high cost of sales rep churn. A solid RI platform delivers a clear return by tackling these expensive problems head-on. When you're evaluating options, focus on the potential ROI—like a 15% boost in win rates or a 10% shorter sales cycle—not just the subscription cost. The true cost lies in continuing to fly blind.
Altior & Co. helps B2B SaaS and Fintech companies move from guesswork to predictable growth. Our 6-Week Revenue Growth Sprint applies this exact framework to uncover and fix the hidden leaks in your revenue engine.
Learn how the 6-Week Revenue Growth Sprint can apply this framework to your business