Stop guessing your Marketing ROI. This guide reveals a RevOps framework to diagnose, calculate, and improve your return for measurable B2B SaaS growth.
For B2B SaaS companies, true Marketing ROI isn't just a campaign report—it’s the engine of sustainable growth. It measures the revenue you generate for every euro spent on marketing, but its real power comes from connecting those activities directly to the financial health of your business.
What Marketing ROI Really Means for B2B SaaS

A laptop screen inside a car displays 'TRUE MARKETING ROI' next to a car's dashboard gauges.
Stop chasing vanity metrics. Clicks and impressions might look good on a slide deck, but they don't tell you if your go-to-market strategy is actually working. For a growing B2B SaaS business, a meaningful grasp of Marketing ROI means shifting the conversation from campaign outputs to genuine business outcomes.
Think of your company's performance metrics like a car's dashboard. Clicks, likes, and website visits? That's the volume on your radio. It proves something is happening, but it won’t get you to your destination.
True ROI is measured by the critical gauges showing the health of your engine: your fuel level and engine temperature.
The Real Gauges of Your Revenue Engine
For a B2B SaaS company, those critical gauges are your Customer Lifetime Value (CLV) and Customer Acquisition Cost (CAC). These two metrics are the bedrock of a healthy, predictable, and scalable business. They elevate the conversation from "How many leads did we get?" to "How much profitable revenue did our marketing efforts generate?"
A RevOps-aligned approach demands this level of clarity. It frames Marketing ROI not as a marketing-only metric, but as a strategic indicator of your entire revenue engine’s efficiency.
According to a report from SaaStr, for every $1 brands invest in email marketing, they can earn an average of $36. This shows how a single, well-measured channel can produce huge returns, but only if you track its impact on actual revenue, not just open rates.
Moving Beyond the Campaign Report
When you see ROI through this lens, you get a much clearer picture of your go-to-market health. This perspective helps you answer the questions that actually matter for sustainable growth:
- •Efficiency: How effectively are we turning marketing spend into long-term, profitable customer relationships?
- •Predictability: Can we reliably forecast future revenue based on our current marketing investments?
- •Scalability: If we invest another €100,000 in marketing, can we confidently project the return and its impact on our bottom line?
This is the Altior philosophy in action: building systems that reveal the truth. By focusing on these core financial outcomes, you stop celebrating noise and start measuring what drives real growth. This sets the stage for a data-driven RevOps framework that turns marketing from a cost center into a proven revenue driver.
Why Your Current Marketing ROI Calculations Are Broken
Most B2B leaders think they have a solid grip on marketing performance. You glance at a dashboard, see a healthy flow of MQLs, and assume the engine is running smoothly. But what if the numbers you’re tracking are telling you a convenient story instead of the truth?
Your measurement systems are likely built on flawed assumptions and dangerous data gaps, leading to misallocated budgets and missed revenue opportunities. This isn't about a lack of effort; it's about relying on outdated models that don't reflect how B2B buyers actually buy.
The result is a warped view of your Marketing ROI where credit is assigned incorrectly and the most valuable touchpoints get completely ignored. This disconnect between perception and reality is one of the most common—and costly—issues we uncover.
The Myth of the Single Touchpoint
One of the biggest culprits is simplistic attribution. Models like 'first-touch' or 'last-touch' are easy to set up but dangerously misleading. Was it really the first blog post a prospect read six months ago that closed a €250,000 deal? Or the final demo request form they filled out?
A sales leader might report 80% MQL follow-up compliance based on team check-ins. But when you dig into the CRM data, the reality is often closer to 25%—with many high-value leads never getting a single call. This gap doesn't just hurt sales; it completely invalidates the marketing spend that generated those leads.
Relying on this flawed logic leads to terrible decisions. You might pump money into bottom-of-funnel ads because they get all the 'last-touch' credit, while gutting the mid-funnel content that actually built trust and nurtured the relationship for months. It's like rewarding only the final step of a marathon and ignoring all the miles that came before it.
The modern B2B customer journey is a messy, non-linear web of interactions. According to Gartner, buyers spend a mere 17% of their time meeting with potential suppliers. The rest of their journey is independent research, bouncing between channels. Attributing a complex sale to a single interaction is like crediting the final signature on a contract for the entire negotiation process.
Disconnected Data and Broken Handoffs
Beyond flawed attribution, your ROI calculations are being sabotaged by operational gaps hiding in plain sight. Disconnected systems and a broken alignment between sales and marketing create data black holes where value simply disappears.
Imagine this all-too-common scenario:
- •Marketing generates a fantastic, high-intent lead from a webinar.
- •The lead is passed to sales, but the handoff is slow or manual.
- •The salesperson, swamped with other tasks, doesn’t follow up for 48 hours.
- •By then, the prospect has already moved on or engaged a competitor.
In this case, marketing’s entire investment is wasted. The CRM might show a "closed-lost" opportunity, but the real cause was an operational failure, not a marketing one. Yet, without a unified view of the entire revenue process, marketing’s ROI takes the hit every time.
To get a truly accurate picture of Marketing ROI in B2B SaaS, it's essential to understand how to calculate Customer Lifetime Value, which is a key driver of your overall return. When your CLV is high, even small operational leaks can cost you tens of thousands in future revenue. This diagnostic check-up is the first step toward building a measurement system based on truth, not assumptions.
Choosing the Right Attribution Model for Your Business
Attribution isn't a one-size-fits-all puzzle. The model you choose directly shapes your Marketing ROI calculation and, more critically, dictates how you value every single touchpoint in your customer's journey. Sticking with a default setting is like using a map of London to navigate Dubai—you’ll end up completely lost.
Think of it like assigning credit for a championship win. Did the victory come down to the person who scored the final goal? Or does the entire team that moved the ball down the field deserve credit? A simplistic model only sees the goal scorer; a smarter model recognizes the entire play.
Getting this right is the difference between guessing what works and knowing what drives revenue. It’s how you move from budget debates to confident investments.
From Single-Touch Simplicity to Multi-Touch Clarity
Attribution models range from the brutally simple to the deeply nuanced. For B2B SaaS companies with long, winding sales cycles, this distinction is everything. A single touchpoint rarely tells the whole story.
Let's break down the usual suspects:
- •First-Touch Attribution: This model gives 100% of the credit to the very first interaction a prospect has with your brand. It’s great for understanding what initially brings people into your orbit, but it completely ignores every action they take afterward. As a tool for measuring what actually converts, it falls flat.
- •Last-Touch Attribution: The polar opposite. This model assigns 100% of the credit to the final interaction before a deal closes. While easy to track, it massively overvalues bottom-of-funnel actions (like a demo request) while giving zero credit to the top- and mid-funnel content that built trust and interest in the first place.
These single-touch models offer a dangerously incomplete picture. They often trick teams into over-investing in channels that appear to be closing deals while gutting the budgets for the very activities that created those opportunities to begin with.
Advanced Models for Complex Journeys
To accurately map a non-linear buying process, you need a model that distributes credit across multiple interactions. This is where you get a much clearer, more honest view of what’s actually working.
According to HubSpot, businesses that switch from single-touch to multi-touch attribution are far better at proving marketing's real impact on revenue. It fundamentally shifts the question from "Which single campaign worked?" to "How did our combined efforts create this customer?"
Here are the multi-touch models that give you that clearer view:
- •Linear Attribution: The simplest of the bunch. This model gives equal credit to every single touchpoint in the journey. It’s a fair way to acknowledge that every interaction played a role, but it doesn't distinguish between a casual blog visit and a critical product demo.
- •Time-Decay Attribution: This model gives more credit to the touchpoints that happened closer to the conversion. It’s built on the idea that later-stage interactions are more influential, making it a solid choice for businesses with shorter, more condensed sales cycles.
- •U-Shaped (Position-Based) Attribution: A popular model for B2B. It gives 40% of the credit to the first touch, 40% to the lead conversion touch, and spreads the remaining 20% across all the interactions in between. This approach rightly emphasizes the importance of both creating initial awareness and driving the final conversion.
To help you decide which model aligns best with your business, here's a quick comparison of the most common options.
Comparison of Marketing Attribution Models for B2B SaaS
| Attribution Model | How It Works | Pros | Cons | Best For |
|---|---|---|---|---|
| First-Touch | 100% credit to the first interaction. | Simple; good for top-of-funnel analysis. | Ignores all subsequent interactions. | Understanding demand generation channels. |
| Last-Touch | 100% credit to the final interaction. | Easy to implement and measure. | Undervalues early and mid-funnel marketing. | Quick analysis with limited data. |
| Linear | Equal credit to all touchpoints. | Simple multi-touch view; acknowledges entire journey. | Doesn't weigh impact; treats all touches equally. | Companies wanting a baseline multi-touch view. |
| Time-Decay | Credit increases closer to conversion. | Emphasizes actions that close deals. | Can undervalue crucial early touchpoints. | Shorter sales cycles where recent activity is key. |
| U-Shaped | 40% to first touch, 40% to conversion, 20% spread. | Balances awareness and conversion events. | Mid-funnel touches can be under-represented. | B2B SaaS with a focus on lead generation. |
Choosing the right approach is fundamental to building a reliable system. To learn more about how these models work in practice, you can explore our detailed guide on multi-touch attribution.
Ultimately, selecting a model that accurately reflects your unique customer journey—not just an industry default—is the first step toward building a revenue engine based on truth, not guesswork.
A RevOps Framework for Driving Measurable ROI
Knowing your numbers are broken is one thing; fixing them is a whole different beast. This is where we move from theory to action. A Revenue Operations (RevOps) framework gives you a blueprint to re-engineer your entire measurement system, pulling you out of the land of guesswork and gut feelings and into a single source of truth for what’s actually driving revenue.
This isn’t about some high-level strategy that collects dust in a slide deck. It’s a phased, actionable plan for building a revenue engine that amplifies truth, not noise. By systematically fixing your data, attribution, alignment, and experimentation, you build a durable system that consistently improves your marketing ROI.
Phase 1: Build Your Data Foundation
You can't measure what you can't see. The very first step is building a rock-solid data architecture that becomes your single source of truth. This means finally unifying data from your CRM, marketing automation platform, and other go-to-market tools into one cohesive view of the customer journey.
The goal here is simple: eliminate data silos. When your sales data in Salesforce doesn’t talk to your marketing engagement data in HubSpot, you're flying blind. A unified data model ensures every single touchpoint is captured and tied to a single contact and account record. This creates the clean foundation for everything that follows.
This process involves:
- •Data Auditing: Identifying and mapping every source of customer and revenue data you have.
- •System Integration: Connecting your tech stack so data flows automatically and accurately between systems. No more manual exports.
- •Data Hygiene: Implementing processes to clean, standardize, and de-duplicate records to ensure you can actually trust your numbers.
Phase 2: Implement Automated Attribution
With a clean data foundation in place, you can finally move on to a more sophisticated attribution model. This phase is all about graduating from simplistic first or last-touch models to a multi-touch approach that actually reflects your true customer journey.
This is where the right technology becomes non-negotiable. Manual attribution is a nightmare at scale, so you need tools that can automatically track every interaction—from the first blog visit to the final sales call—and assign credit based on your chosen model (like U-shaped or Time-Decay). This visual shows the most common attribution models and where they fit.
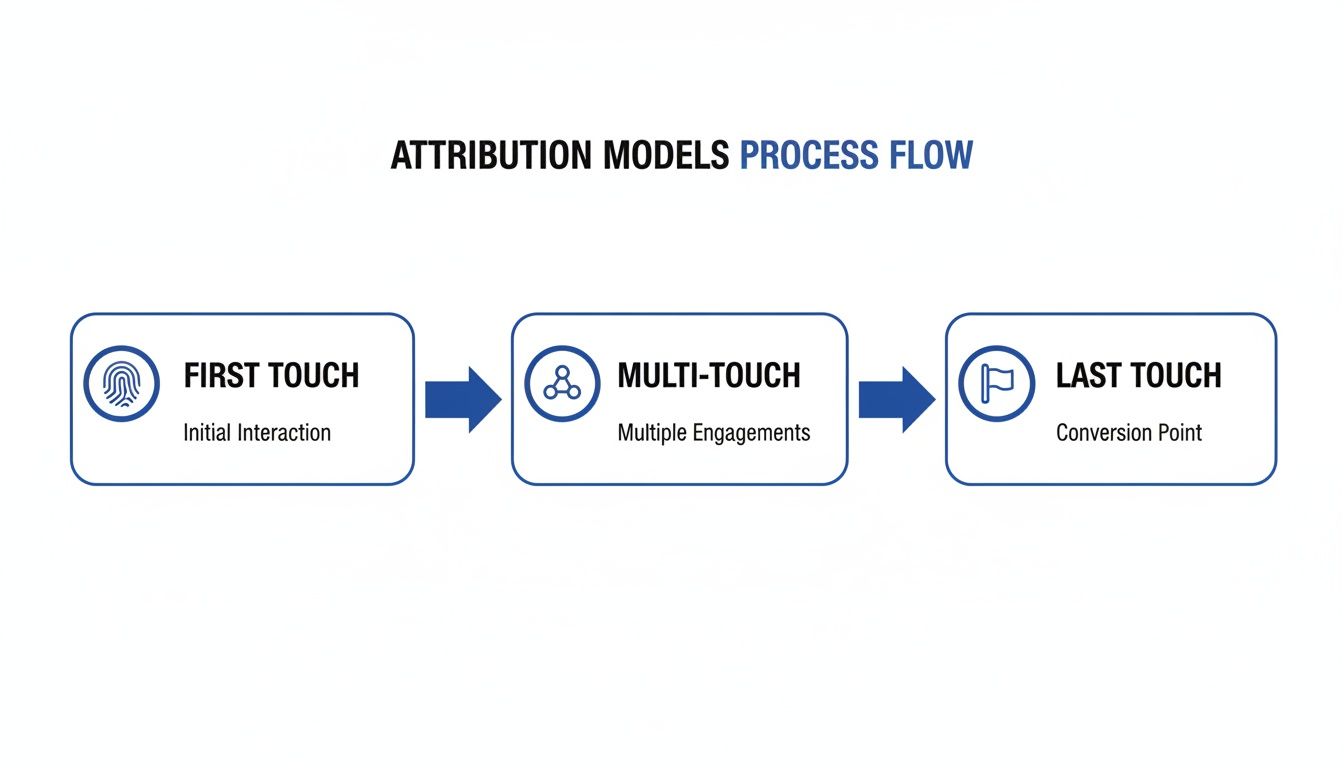
Flowchart illustrating attribution models process flow with First Touch, Multi-Touch, and Last Touch stages.
This process flow highlights how different models assign value, helping you pick one that truly mirrors how your customers buy. Implementing an automated multi-touch model gives you the clarity to see which channels and campaigns are genuinely influencing deals, not just generating the first click.
"A common perception is that RevOps is just about tooling. In reality, it's a strategic function that forces alignment through shared data and accountability. The tool is the enabler, but the process is the value." - Jared Fuller, Co-founder of RevGenius
This shift is crucial for optimizing your spend. You stop guessing and start making data-backed decisions about where to invest your next marketing dollar for the highest possible marketing ROI. For a deeper look into the operational side of this, check out our insights on what RevOps is and why it matters.
Phase 3: Forge True Sales and Marketing Alignment
Your measurement system is only as strong as the operational alignment supporting it. Phase 3 is laser-focused on bridging the chronic gap between sales and marketing by establishing shared goals and crystal-clear rules of engagement. This is where you formalize the handoff process with a Service Level Agreement (SLA).
An SLA is a written commitment between sales and marketing that defines responsibilities, timelines, and shared KPIs. It answers critical questions like:
- •What is the exact definition of a "sales-ready lead"?
- •How quickly must a salesperson follow up with a new MQL? (e.g., within 2 hours)
- •How many follow-up attempts are required before a lead can be dispositioned?
This isn't just another document; it's a contract for accountability. It ensures marketing’s investment in lead generation isn't wasted by slow or nonexistent follow-up, directly protecting your marketing ROI.
Phase 4: Run Measurable Experiments
With your data, attribution, and alignment finally in place, you can move to the most valuable phase: continuous optimization. This final step is about creating a system for running measurable marketing experiments. Instead of making big, risky bets, you can test hypotheses in a controlled way.
For instance, you might run an A/B test on a new ad campaign targeting a specific segment. With your RevOps framework, you can track the results not just in terms of clicks but in pipeline generated and deals closed. This creates a powerful feedback loop where every single marketing action becomes a learning opportunity.
The pressure to prove value is mounting everywhere. As highlighted by Forrester, CFOs are increasingly demanding that CMOs provide clear justification for every euro spent, connecting tactical campaigns to strategic growth. This framework transforms marketing from a creative-led function to a science-driven revenue engine, building systems that consistently amplify truth.
The Essential RevOps Dashboard for B2B SaaS
Desk with Apple iMac displaying a colorful REVOPS KPI dashboard, keyboard, mouse, and plants.
We’ve all heard the old saying, "What gets measured gets managed." But it skips over the most important question: are you measuring what actually matters? For too long, marketing teams have been judged on top-of-funnel fluff like lead volume and click-through rates. A true RevOps approach demands a shift from measuring activity to measuring business outcomes.
A unified RevOps dashboard is your single source of truth. It’s designed to pull data from your CRM, marketing automation platform, and financial systems into one real-time view. This gives you an honest, unfiltered look at your entire revenue engine's performance. It’s time to graduate from vanity metrics and focus on the KPIs that directly signal revenue health.
Key Metrics for Your RevOps Dashboard
Your dashboard shouldn't be a cluttered mess of charts. It needs to tell a clear, concise story about how efficiently you're turning marketing spend into profitable growth. Here are the non-negotiable KPIs every B2B SaaS company over €4M ARR should be tracking daily.
- •
CAC Payback Period: How many months does it take to earn back the money spent acquiring a new customer? A healthy B2B SaaS company should aim for a payback period of 12 months or less. Anything longer can signal problems with pricing, churn, or acquisition efficiency, putting a serious strain on your cash flow.
- •
LTV to CAC Ratio: The Lifetime Value (LTV) to Customer Acquisition Cost (CAC) ratio is the ultimate stress test for your go-to-market model's sustainability. A healthy ratio for a growing SaaS business is 3:1 or higher. If you’re at 1:1, you're literally losing money with every new logo. A ratio of 5:1 or more suggests you have a highly efficient revenue engine ready for more investment.
- •
Marketing Originated Customer %: This KPI tracks the percentage of new customers that started their journey as a marketing-generated lead. It’s one of the most powerful ways to prove marketing’s direct contribution to new business. Top-performing teams often see 20–40% of new business originating from marketing efforts, validating the impact of their demand generation.
- •
Pipeline Velocity: How quickly are deals moving through your sales funnel, from the first touch to closed-won? This metric is calculated by multiplying the number of opportunities, the average deal size, and the win rate, then dividing it all by the length of the sales cycle. Increasing velocity is one of the most direct levers you can pull to accelerate revenue growth.
Interpreting the Numbers
Knowing the metrics is only half the battle. You have to understand how they relate to each other and what story they're telling. For instance, a sky-high LTV to CAC ratio is great, but if your CAC payback period is creeping over 18 months, your growth could still be too capital-intensive to sustain.
A common blind spot is celebrating new logo acquisition while completely ignoring the cost. A CEO might get excited about landing 50 new customers this quarter, but if the CAC Payback Period is 24 months, the company is effectively funding two full years of operations for those customers before ever seeing a return. That’s not a growth strategy; it’s a path to burning cash.
A proper RevOps dashboard connects these dots for you. It helps you see how a drop in pipeline velocity will impact next quarter’s revenue or how a rising CAC is quietly eroding your overall Marketing ROI. For a deeper dive, explore our guide to mastering revenue analytics.
The global push for measurable outcomes is undeniable. Data from Salesforce shows that 84% of customers say the experience a company provides is as important as its products, and that experience is built on data-driven personalization. Your dashboard is the tool that allows you to meet this modern standard by ensuring every marketing dollar is spent creating a valuable, trackable journey.
Your 6-Week Sprint to Actionable Marketing ROI
All the frameworks and dashboards in the world mean nothing until you put them into practice. So, let's get practical. This isn't some year-long strategic project; it's a focused, six-week sprint designed to get you from a messy reality to measurable optimization, fast.
We're going to build the revenue engine we've been talking about, piece by piece. Following this timeline creates momentum, proves the value of a RevOps-aligned marketing approach, and delivers tangible results you can take to the board.
Weeks 1-2: The Reality Check – System Audit and Data Unification
The first two weeks are about confronting the truth. You need to dig into your tech stack and data architecture to find out where the real gaps are.
- •Week 1 – Audit the Current Mess: Map out every single system that touches customer data—your CRM, marketing automation, analytics platforms, you name it. Your job is to find where data gets stuck, siloed, or just plain lost in translation. This is where you uncover the painful disconnects between what you think is happening and what’s actually happening.
- •Week 2 – Build a Single Source of Truth: Start connecting the dots. The goal is to get your systems talking to each other so every marketing touchpoint is captured and tied to a contact and an account. This is the foundational plumbing work. Without it, reliable attribution is just a pipe dream.
Weeks 3-4: Laying the Foundation – Attribution and Baselines
With cleaner data flowing, it's time to build your measurement framework. This is where you stop guessing and start measuring what matters.
- •Week 3 – Choose Your Attribution Model: Pick a multi-touch attribution model that actually reflects how your customers buy. Whether it's U-shaped or Time-Decay, the key is to choose a model that gives credit where it's due across the entire journey, not just the first or last click. Then, get it configured in your systems.
- •Week 4 – Build Your First RevOps Dashboard: Now, create your baseline dashboard. Forget vanity metrics. Focus on the core KPIs we've discussed: CAC Payback Period, LTV:CAC ratio, and pipeline velocity. These numbers are your "before" picture—your starting point for measuring every improvement from here on out.
Weeks 5-6: The Launchpad – Experimentation and Cadence
You've built the machine. Now it's time to turn it on. This final phase is about running your first controlled experiment and locking in a rhythm of continuous improvement.
- •Weeks 5 & 6 – Launch and Measure: It's go-time. Run your first truly measurable marketing experiment—a new ad campaign, a different content offer, an account-based play. The crucial part? You're not tracking clicks and impressions. You’re tracking its direct impact on pipeline generated and opportunities influenced. Then, set up a weekly review to analyze the results and plan the next sprint.
Measurable Outcome: By sticking to this 6-week plan, you can realistically expect a 15–25% improvement in your marketing-influenced pipeline velocity within a single quarter.
This structured sprint turns marketing ROI from a fuzzy, backward-looking report into a sharp, forward-looking lever for predictable growth. As you get this system running, having the right email outreach tools for high-ROI campaigns can be a massive accelerant.
The Quick-Fire Answers You're Looking For
You've got the framework, but let's cut to the chase. Here are the straight answers to the most pressing questions we hear from B2B SaaS leaders trying to nail down their Marketing ROI.
What Is a Good Marketing ROI for a B2B SaaS Company?
While there’s no magic number, the gold standard is a 5:1 LTV to CAC ratio. That means for every single euro you pour into acquiring a customer, you should be getting at least five back over their lifetime with you.
But "good" is all about context. If you're an early-stage startup aggressively trying to grab market share, you might stomach a 3:1 ratio for a short time. On the other hand, if you're a well-established player, you should be pushing for 7:1 or higher to prove you’re running an efficient, profitable growth engine.
How Long Should Our CAC Payback Period Be?
For most venture-backed B2B SaaS companies, the line in the sand is 12 months or less. You need to recoup the entire cost of acquiring a new customer within their first year. Full stop.
If your payback period is creeping past 18 months, that’s not just a metric—it’s a warning light on your dashboard. It signals potential trouble with your pricing, churn, or the overall efficiency of your go-to-market motion, and it puts a serious strain on your cash flow.
Which Attribution Model Is Best for a Long Sales Cycle?
Forget single-touch models. For B2B SaaS with sales cycles that stretch six months or more, they’ll give you a dangerously misleading picture of what’s actually driving deals. You absolutely need a multi-touch model.
A U-shaped or W-shaped model is usually your best bet. These models give credit where it's due, weighting the most critical moments in a long, complex buying journey: the first touch that sparked awareness, the lead conversion that signaled real interest, and the opportunity creation touch that showed a serious intent to buy.
How Can We Measure the ROI of Content Marketing?
You have to stop looking at vanity metrics like page views and social shares. They don't pay the bills. The only way to prove content's value is to tie it directly to revenue using your RevOps framework.
Here’s a simple, three-step reality check:
- •Track Origination: What percentage of your customers ("Marketing Originated Customer %") came directly from a specific blog post, webinar, or downloadable guide?
- •Track Influence: How many deals in your pipeline were touched by a piece of content at any point in their journey, not just the beginning?
- •Calculate Pipeline Value: Add up the total pipeline value influenced by your content. Now, stack that number up against what you spent to create it. This gives you a clear, financial scorecard for your content efforts.
Ready to stop guessing and start building a revenue engine based on truth? Altior & Co. helps B2B SaaS companies uncover hidden revenue leaks and build scalable growth systems.
Learn how the 6-Week Revenue Growth Sprint applies this framework to your business.