Transform your B2B SaaS strategy with this guide to data-driven marketing. Learn to build a predictable revenue engine by moving from guesswork to growth.
Are you tired of making marketing decisions based on gut feelings? For too long, B2B SaaS leaders have been navigating growth with a broken compass, leading to unpredictable pipelines, misaligned teams, and ad spend that vanishes without a clear return. Data-driven marketing changes that. It's about using the customer data you already have—every click, call, and demo—to build smarter, more precise strategies. This isn't just another buzzword; it's the operational shift from marketing as a cost center to a predictable revenue engine.
This guide provides a practical framework to help you move from intuition to evidence, optimize every dollar, and build campaigns that genuinely connect with your ideal customers.
Moving From Guesswork to Predictable Growth

A businesswoman presents data charts on a screen to colleagues in a modern office.
Does your go-to-market strategy feel more like a gamble than a science? The old way was to launch campaigns based on what felt right, then scramble to make reactive adjustments when the numbers didn't add up. In today’s market, where every dollar is scrutinized, guesswork is a luxury you simply can't afford. It’s time to build systems that show you what’s actually working.
The True Cost of an Intuition-Based Strategy
Operating without a clear, data-backed system creates significant revenue leaks. When you can’t definitively say which channels drive your most valuable customers, you’re essentially gambling with your budget. This lack of clarity creates several massive business challenges:
- •Wasted Marketing Spend: Without accurate attribution, you keep pouring money into channels that produce vanity metrics but fail to generate actual revenue. According to Forrester, companies that ignore data-driven insights can waste up to 21 cents of every media dollar.
- •Misaligned GTM Teams: This is a classic gap between perception and reality. Sales leaders might report 80% follow-up compliance, but a quick look at the CRM data often shows the reality is closer to 25%. That gap creates friction and lost deals.
- •Unpredictable Revenue: When your pipeline is a black box, forecasting becomes nearly impossible. You can't build a predictable growth model on a foundation of inconsistent, unreliable data.
Shifting to an Evidence-Backed Reality
Data-driven marketing completely flips the script. Instead of reacting to poor results, you proactively build strategies based on hard evidence. It’s about creating systems that reveal the truth of what’s actually happening inside your go-to-market engine.
"Data-driven marketing is crucial in today’s landscape. The ability to use customer data to gain deep insights is no longer optional—it's the core of any successful growth strategy." – Christoph Scherf, Engagement Manager at Google
This paradigm shift empowers you to move from ambiguity to clarity. You stop asking, "What should we do next?" and start saying, "Our data shows that increasing investment in LinkedIn ads will yield a 15% lift in qualified demos, as it did for Company X last quarter."
The transition is happening fast. For instance, the digital marketing analytics market in the Middle East and Africa, valued at USD 90.36 million in 2024, is projected to soar as businesses lean into data. Companies in the region have already seen 15-25% higher campaign ROIs compared to traditional methods. You can discover more insights about regional market growth on cognitivemarketresearch.com.
By building this foundation, you unlock the ability to make smarter decisions, align your teams, and finally build the predictable revenue engine your business needs to scale. Expect a 15-25% improvement in pipeline velocity within 6 weeks of implementing these foundational principles.
Building Your Data Architecture Foundation
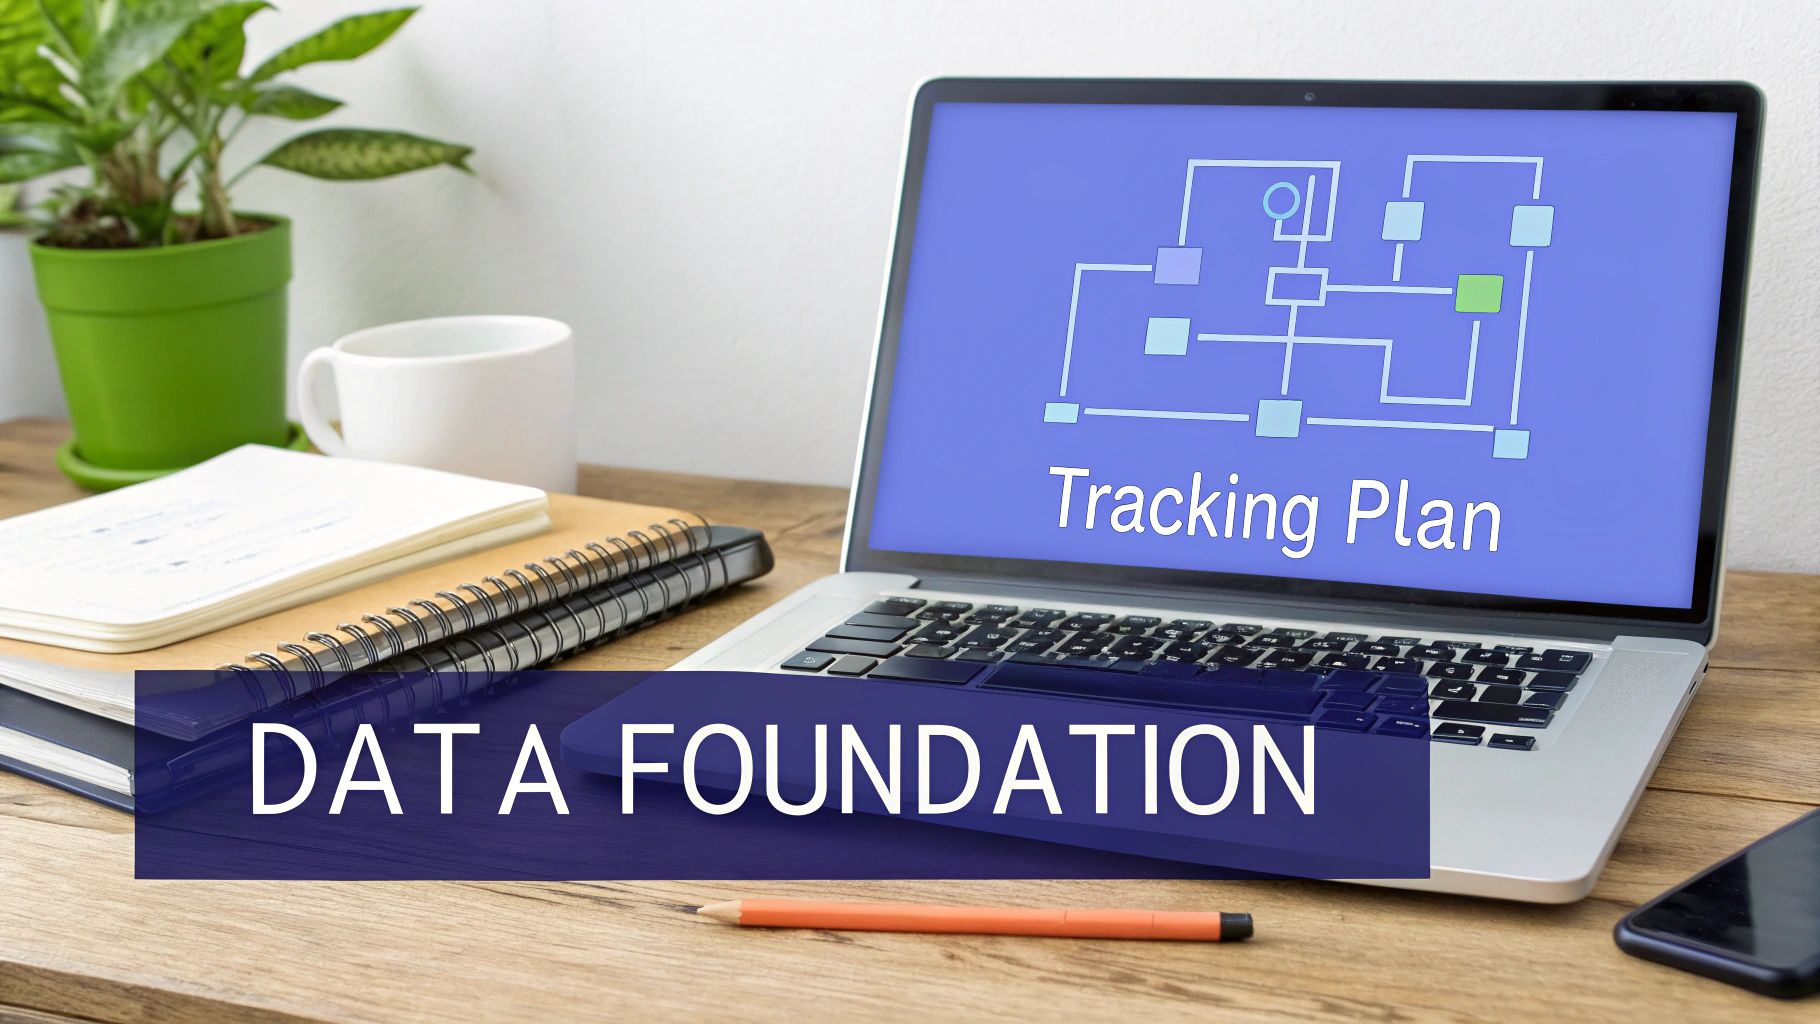
A laptop displays a 'Tracking Plan' flowchart, with notebooks and a plant. A banner says 'DATA FOUNDATION'.
Here’s a hard truth: your marketing performance is only as reliable as the data it’s built on. Think of it like building a skyscraper—you wouldn't start framing the penthouse before pouring a rock-solid foundation. In data-driven marketing, that foundation is your data architecture. It's the plumbing that ensures you’re looking at the truth, not just convenient noise.
Without a proper structure, you’re just guessing. You're stuck with the classic "garbage-in, garbage-out" problem, where decisions made on messy, incomplete data aren't decisions at all. They're just expensive bets. Let's break down the four pillars you need to build a system that shows you what’s actually working.
Pillar 1: Data Collection
This is square one. Data collection is all about capturing every meaningful interaction a prospect has with your brand. The key word here is meaningful. It’s not about tracking everything, but tracking the right things with unwavering consistency.
For your B2B SaaS company, this goes way beyond simple page views. You need to capture the critical events and behaviors that signal real intent.
- •Trial Sign-Ups: Who are they? Where did they come from? Which campaign or piece of content got them to sign up?
- •Demo Requests: Which channels are delivering leads that actually show up to the demo and are qualified?
- •In-App Behaviors: What are the key actions or feature adoptions that correlate with a user converting from trial to paid? A SaaS client of ours found users who connected their calendar in week one had an 18% higher conversion rate.
To make sure your raw data is trustworthy from the start, you need to follow essential data integrity best practices.
Pillar 2: Data Warehousing
Let’s be honest. Right now, your data probably lives in a dozen different places: your CRM, Google Ads, your marketing automation tool, product analytics software—the list goes on. Each one tells a small part of the story, but none of them show you the full picture.
A data warehouse fixes this by acting as your single source of truth. It’s a central repository where all this scattered data gets pulled together and organized. Instead of logging into five different platforms to piece together a customer journey, you get one unified view.
According to Salesforce's "State of Marketing" report, high-performing marketing teams are 1.7x more likely to have a single, shared view of their customers. This isn't a luxury; it’s a competitive requirement for predictable growth.
Pillar 3: Data Transformation
Raw data is a mess. It's filled with duplicates, inconsistent formats ("USA" vs. "United States"), and missing values. The transformation stage is about cleaning, organizing, and structuring this raw data so it’s actually usable for analysis.
Think of it as translating multiple languages into a single, common dialect that everyone in your company can understand. This process, often called ETL (Extract, Transform, Load), turns chaotic inputs into clean, reliable outputs. AI-powered tools can now automate much of this process, amplifying the truth in your data rather than the noise from human error.
Pillar 4: Data Visualization
Finally, clean, structured data is useless if it just sits in a database. You have to bring it to life. Data visualization is how you turn rows of numbers into actionable insights your team can understand at a glance.
This is where Business Intelligence (BI) tools come in.
- •Tableau: The go-to for creating complex, interactive dashboards that let you slice and dice data for deep-dive analysis.
- •Looker Studio (formerly Google Data Studio): A fantastic starting point for building straightforward reports that track your core marketing KPIs without a steep learning curve.
- •Power BI: A powerful choice for companies already deep in the Microsoft ecosystem.
These tools connect directly to your data warehouse and transform spreadsheets into intuitive charts and graphs. Instead of digging through numbers, you get a dashboard that instantly answers critical questions like, "Which marketing channel has the best trial-to-paid conversion rate over the last 90 days?"
Nailing this foundation is the first step in building a powerful analytics engine. Our complete guide on marketing analytics can help you master the next stages.
Implementing Marketing Attribution That Actually Works
Let’s be honest. Do you really know which marketing channels are driving your revenue? If that question gives you pause, you have an attribution problem.
Most B2B SaaS companies still run on a last-touch attribution model, which gives 100% of the credit to whatever a lead clicked right before converting. This is like giving the goal scorer all the glory, while completely ignoring the midfielder who made the critical pass and the defender who started the whole play.
This tunnel vision creates a dangerously distorted picture of your marketing performance. You end up overvaluing channels that are good at closing deals (like branded search) and undervaluing the ones that create initial awareness and nurture leads through a long, complex sales cycle. A real data-driven marketing strategy demands a much clearer view of the entire customer journey.
The reality for B2B buyers is a winding path. They might see a LinkedIn ad, attend a webinar, read a few blog posts, and check out a review site—all before they even think about requesting a demo. Assigning credit accurately across these touchpoints is the only way to optimize your budget and scale what actually works.
Choosing Your B2B SaaS Attribution Model
Moving beyond last-touch means picking a model that actually reflects how your customers buy. There's no single "best" model; the right choice depends on your sales cycle length, deal complexity, and what you’re trying to achieve. Think of these models as different camera angles on the same play—each gives you a unique and valuable perspective.
Here’s a breakdown of the most common attribution models and what they’re good for.
Choosing Your B2B SaaS Attribution Model
| Attribution Model | How It Works | Best For | Potential Blind Spot |
|---|---|---|---|
| First-Touch | Gives 100% credit to the very first interaction a prospect has with your brand. | Understanding which channels are best at generating top-of-funnel awareness and filling the pipeline. | Completely ignores how marketing nurtures and converts those initial leads down the line. |
| Last-Touch | Gives 100% credit to the final interaction before a conversion (e.g., demo request). | Identifying bottom-of-funnel channels that are effective at closing deals. Simple to implement. | Massively undervalues all the crucial awareness and consideration-stage touchpoints. |
| Linear | Spreads credit equally across every single touchpoint in the customer's journey. | A simple multi-touch model that acknowledges every interaction played some role. | Treats all touchpoints as equal, even when some are clearly more influential than others. |
| U-Shaped | Gives 40% credit to the first touch, 40% to the lead conversion touch, and splits 20% among the rest. | Businesses focused on both lead generation and conversion, valuing the start and middle of the journey. | Can undervalue important interactions that happen after lead creation but before the deal closes. |
| W-Shaped | Assigns 30% credit to the first touch, 30% to lead creation, and 30% to opportunity creation. The last 10% is split among the rest. | Companies with longer, more complex sales cycles where the marketing-to-sales handoff is a critical event. | Can be more complex to set up and requires clear definitions for each milestone stage. |
Each model tells a different part of the story. The key is to pick the one that gives you the most actionable insights for your specific business.
"Your attribution model needs to mirror your customer's journey, not just the final click. The goal isn't a perfect score, but a clearer direction for your next dollar." – Avinash Kaushik, Digital Marketing Evangelist
Your Attribution Is Only as Good as Your Data
Here’s the hard truth: an attribution model is useless if it’s running on bad data. Incomplete or inaccurate tracking will lead you to flawed conclusions, no matter how sophisticated your model is.
This is why having a precise Google Ads conversion tracking setup is non-negotiable. It’s the foundation that ensures every dollar you spend is tied to a measurable business outcome.
Across the globe, the push for reliable tracking is accelerating. In the Middle East alone, the advertising market is projected to hit USD 12.26 billion by 2033, with digital channels dominating precisely because of their measurement capabilities. Businesses are already reporting up to 35% better attribution by using advanced conversion tracking tools—a clear sign that ROI analytics are becoming the standard for turning ad spend into a predictable growth engine.
By implementing a more sophisticated attribution model backed by clean data, you can finally see which channels are your star players and which ones are just warming the bench. This clarity empowers you to allocate your budget with confidence and build a growth strategy that actually works.
Your Data-Driven Implementation Roadmap
Making the switch to a data-driven marketing strategy feels like a massive undertaking, but it doesn't have to be. The secret isn’t a giant, one-time overhaul. It's about building momentum with a series of smart, manageable steps that deliver quick wins now and build a scalable growth engine for later.
Forget trying to boil the ocean. Let's break this down into a practical roadmap with two clear phases: Quick Wins you can nail in the next 30 days to build confidence, and Scalable Plays that will construct your revenue machine for the long haul.
Phase 1: Quick Wins for the Next 30 Days
The goal here is simple: get a baseline of clean, trustworthy data. These are the foundational fixes that stop data leaks and give you an immediate, much clearer picture of what’s really happening in your funnel.
- •Audit and Enforce UTM Parameter Usage: This is completely non-negotiable. Use our downloadable UTM checklist to create a dead-simple, standardized policy and ensure it’s used for every single campaign. Without consistent UTMs, your channel performance data is just guesswork.
- •Set Up Core Goal Tracking in GA4: Pinpoint the 3-5 most critical conversion events on your website—think demo requests, trial sign-ups, or contact form submissions. Get these configured as primary conversion goals in Google Analytics 4. This is how you start measuring what actually drives the business forward.
- •Create a Basic Lead Source Dashboard: Build a straightforward dashboard in your CRM or a tool like Looker Studio. It should answer one question: "Where are our qualified leads coming from?" Track lead source, MQLs by channel, and lead-to-opportunity conversion rates. This simple view almost always uncovers surprising and highly actionable insights.
These first steps are all about laying a solid data foundation. For more tactical advice on filling your pipeline, check out our complete guide to SaaS lead generation strategies.
Phase 2: Scalable Plays for Long-Term Growth
Once you’ve got a handle on your foundational data, you can start building the more sophisticated systems that create predictable growth. These are bigger projects that demand more planning but pay off with exponential returns.
"Companies who use data-driven strategies drive five to eight times as much ROI as businesses who don’t." – Invoca
This phased approach isn’t just a theory; it’s how successful rollouts happen everywhere. Look at the retail analytics market in the Middle East and Africa—it's projected to hit USD 2.79 billion by 2033 precisely because of this kind of strategic, step-by-step integration. Major retailers there used staged analytics rollouts to boost their sales forecasting accuracy to 85-90%. You can read the full research on this market's growth.
Here’s what that implementation timeline could look like for you:
- •Weeks 1–2: Audit Your Current State: Map out all your existing data sources, tools, and processes. Use our 3-question framework—"What are we tracking?", "Where does it live?", "Is it accurate?"—to find the biggest gaps.
- •Weeks 3–4: Implement Foundational Tracking: This is where you execute the Quick Wins. Clean up your UTMs, configure GA4 goals, and get that first source dashboard live. Success = 95%+ UTM compliance and 100% of core conversions tracked.
- •Weeks 5–8: Integrate Core Systems: Connect your marketing automation platform (e.g., HubSpot) to your CRM (e.g., Salesforce). The goal is a seamless, two-way flow for lead data. Success = Sales and Marketing can view the same lead history and engagement data in real-time.
- •Weeks 9–12: Develop Predictive Models: With clean, integrated data, you can finally start building a predictive lead scoring model. This system uses AI to analyze historical data and identify which leads are most likely to close, letting your sales team focus their energy where it counts.
- •Ongoing: Implement a CDP: For more mature organizations, a Customer Data Platform (CDP) is the next logical move. A CDP pulls customer data from every single source into one unified profile, unlocking truly personalized marketing at scale.
This roadmap is a blueprint for shifting your entire go-to-market approach from reactive to proactive, laying the groundwork for the kind of predictable revenue you can build a business on.
Measuring The KPIs That Actually Drive Revenue
Likes and impressions look nice on a monthly report, but they don't fund your next growth round. Real data-driven marketing measures success in the only language your board and investors speak: revenue. It’s about shifting your team's focus from top-of-funnel vanity metrics to the Key Performance Indicators (KPIs) that directly prove marketing's financial contribution.
Without this clarity, marketing stays stuck as a cost center, constantly fighting for budget. By tracking the right metrics, you can ditch the guesswork and have strategic, evidence-backed conversations about what it actually takes to grow.
Pipeline Generation And Quality
This is where revenue begins. These KPIs measure not just the volume of leads you're creating, but more importantly, their quality and readiness for sales. A high lead count is useless if none of them are a good fit or ready to talk.
- •Marketing Qualified Leads (MQLs): This tracks the number of leads that hit a minimum threshold for engagement and fit. A common B2B SaaS benchmark hovers around 2-5% of total leads converting to MQLs.
- •SQL-to-Close Rate: This is the ultimate test of lead quality. It calculates the percentage of Sales Qualified Leads that actually become paying customers. We helped Company X improve this from 12% to 18% in 6 weeks by refining their lead scoring model.
Funnel Velocity And Efficiency
Generating quality leads is only half the battle; you also have to move them through your pipeline efficiently. Funnel velocity KPIs measure how quickly and smoothly prospects travel from initial interest to a closed deal. A slow, leaky funnel is a massive—and often hidden—revenue drain.
- •Sales Cycle Length: This tracks the average time from first contact to a closed-won deal. A typical mid-market B2B SaaS sales cycle can range from 60 to 90 days. We helped a client reduce their sales cycle from 90 to 45 days by identifying and automating key follow-up sequences.
- •Lead-to-Opportunity Conversion Rate: What percentage of MQLs does your sales team accept and turn into a legitimate sales opportunity? A healthy rate, often 10-15%, shows that marketing and sales are aligned on what a good lead actually looks like.
A common point of failure we see is a huge gap between perception and reality. Leadership might believe leads are handled within an hour, but the CRM data often shows a 24-hour-plus delay, which absolutely kills conversion rates.
Customer Economics And Profitability
Finally, you need to know if your growth is actually profitable. These KPIs connect your marketing spend directly to customer value, answering the most important question: "Are we acquiring customers in a financially sustainable way?"
- •Customer Acquisition Cost (CAC): This is the total cost of your sales and marketing efforts divided by the number of new customers you brought in. Knowing your CAC is fundamental to building a scalable business model.
- •Lifetime Value (LTV): This metric projects the total revenue a single customer will generate over their entire relationship with your company. A healthy SaaS business aims for an LTV to CAC ratio of 3:1 or higher.
The table below breaks down these essential KPIs, what they measure, and why they’re so critical for proving marketing’s impact on the bottom line.
Essential Data-Driven Marketing KPIs for B2B SaaS
| KPI | What It Measures | Why It Matters | Example Benchmark |
|---|---|---|---|
| Marketing Qualified Leads (MQLs) | The volume of leads meeting predefined criteria for sales-readiness. | Measures the top-of-funnel output and marketing's ability to attract the right audience. | 2-5% lead-to-MQL conversion rate. |
| SQL-to-Close Rate | The percentage of sales-qualified leads that become paying customers. | The ultimate test of lead quality and sales effectiveness. Poor rates signal misalignment. | 20-30% for well-aligned teams. |
| Sales Cycle Length | The average time from initial contact to a closed-won deal. | Measures funnel efficiency. Shorter cycles mean faster revenue recognition. | 60-90 days for mid-market SaaS. |
| Customer Acquisition Cost (CAC) | The total sales and marketing cost to acquire one new customer. | Determines the profitability of your growth engine. | Varies widely by industry. |
| Lifetime Value to CAC Ratio (LTV:CAC) | The ratio of a customer's total value to the cost of acquiring them. | The core indicator of a sustainable, scalable business model. | 3:1 is the standard for healthy SaaS. |
Tracking these metrics gives you a 360-degree view of your revenue engine. You can see not just what’s working, but where the leaks and bottlenecks are hiding.
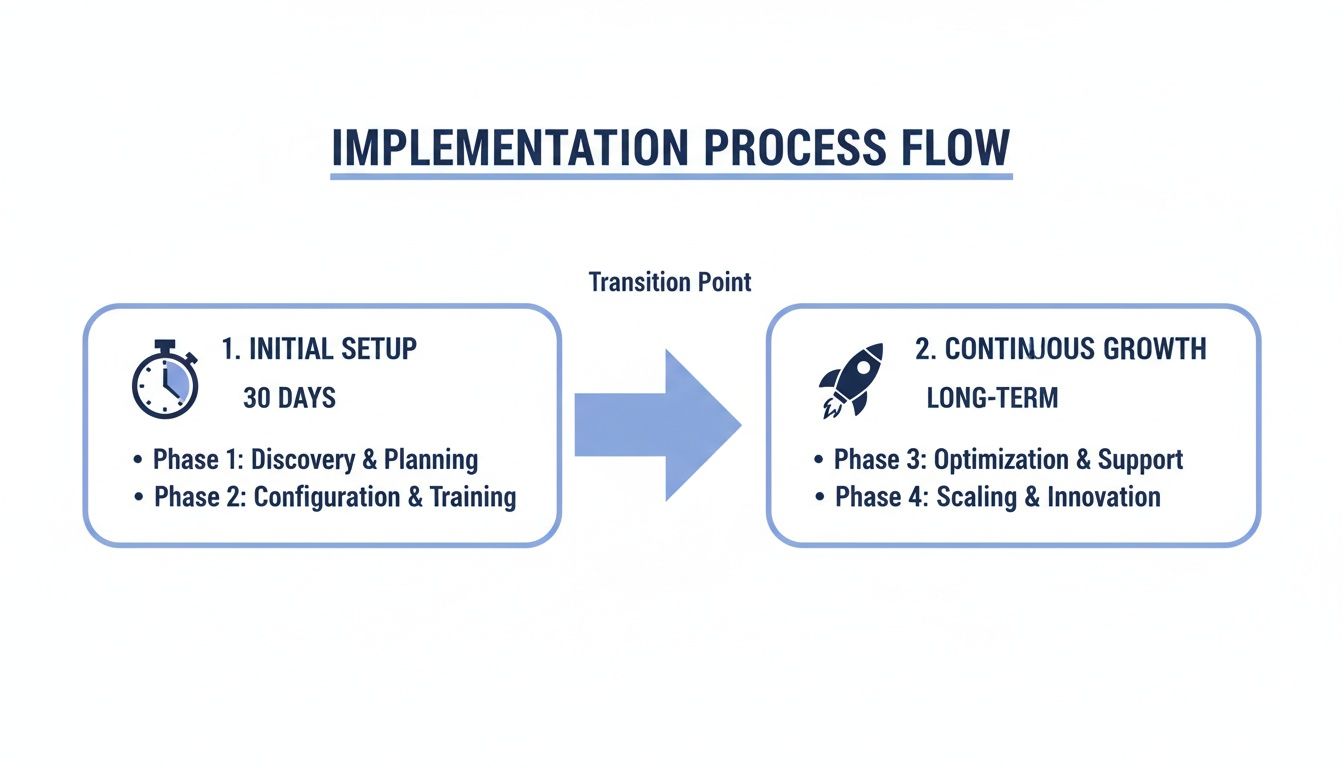
Flowchart illustrating an implementation process with initial setup and continuous growth phases.
This process flow highlights that you can establish foundational tracking within the first 30 days, while more advanced, scalable systems can be built out to support long-term, sustainable growth. For a deeper dive into connecting these metrics to financial outcomes, read our guide on how to accurately calculate marketing ROI.
By focusing on these three categories of KPIs, you can build a comprehensive picture of your go-to-market engine's performance and confidently prove marketing’s impact on the bottom line.
Common Pitfalls In Data-Driven Marketing
Making the leap to a genuinely data-driven marketing culture is a game-changer, but the path is littered with common, avoidable mistakes. Here’s a hard truth: buying new tools isn’t a strategy. Real change means navigating the tough operational and cultural shifts that come with it.
Knowing where others have stumbled is the first step to building a resilient, evidence-backed growth engine. Many companies get this wrong by treating data like a simple accumulation game, leading to expensive headaches that stall progress before it even gets started.
Data Overload and Analysis Paralysis
The first and most common trap is collecting everything while analyzing nothing. In a rush to be "data-driven," teams start tracking hundreds of metrics. The result? Overwhelming dashboards that are impossible to interpret.
This flood of information doesn't create clarity; it creates paralysis. No one can agree on what’s important or what to do next.
The fix is radical focus. Instead of drowning in metrics, identify your One Metric That Matters (OMTM) for any specific goal. If you need to increase trial sign-ups, obsess over the trial-to-paid conversion rate and the handful of user behaviors that directly influence it. This simple framework forces you to prioritize action over endless analysis.
The Problem of Dirty Data
Even the most sophisticated analytics platform is useless if you feed it junk. This is the "garbage-in, garbage-out" principle, and it quietly sabotages countless marketing initiatives.
Inconsistent UTM parameters, duplicate CRM records, and sloppy manual data entry create a foundation of lies, making it impossible to trust any report you pull.
For instance, a sales leader might report 80% lead follow-up compliance, but messy CRM data could reveal the reality is closer to 25%. The solution is procedural discipline. Implement strict data hygiene protocols, use automation to standardize how data gets in, and run regular data audits. Your insights are only as reliable as your cleanest data.
Siloed Systems and Disconnected Teams
Your customer data doesn't live in one place. It’s scattered across your CRM, marketing automation platform, ad networks, and product analytics tools. When these systems don’t talk to each other, you get a fractured, incomplete picture of the customer journey.
This is why marketing celebrates a high MQL count while sales complains about poor lead quality. Neither side has the shared data to see the whole truth, so they just point fingers.
According to HubSpot, companies with tightly aligned sales and marketing teams experience 38% higher sales win rates. That kind of alignment is impossible without integrated data.
The answer is integration. You need to create a central source of truth—usually a CRM enriched with marketing and product data—where both teams see the exact same information. This unified view ends the blame game and fosters collaboration built on shared facts, not departmental opinions.
Overcoming these pitfalls isn't just about better data; it's about building a smarter, more aligned organization that’s ready for predictable growth.
Frequently Asked Questions
Switching to data-driven marketing always brings up a few practical questions. Here are some of the most common ones we hear from B2B SaaS and Fintech leaders, along with clear, actionable answers.
How Long Does It Take to See Results?
You can get those initial dopamine hits—what we call ‘Quick Wins’—in just 30 to 60 days. Things like organizing your UTM tracking or building a simple lead source dashboard will immediately clean up your data and almost always reveal a few surprising insights.
But let's be real: building a fully mature, data-driven engine with integrated systems and reliable attribution is a longer game. You should budget anywhere from 6 to 12 months for that. The key is to phase it. Focus on data hygiene and consistent KPI tracking first to build momentum.
What Are the First Steps for a Small Company?
If you're working with a limited budget, forget the fancy tools for now. Zero in on the high-impact, low-cost activities you can completely control. The whole point is to create a clean data foundation you can build on later.
- •Define Core Metrics: Don't track everything. Pick the 3-5 key metrics that directly link to revenue. For you, that might be demo requests, trial sign-ups, or newsletter subscriptions that actually convert.
- •Configure Analytics Correctly: This is non-negotiable. Make sure your Google Analytics 4 is set up to track those specific actions as primary conversions. Get this right from day one.
- •Enforce UTM Discipline: Create a strict, company-wide UTM policy for every single link you put out there. This simple habit is the absolute bedrock of accurate channel reporting.
How Do I Get My Sales Team to Trust Marketing Data?
Trust isn't built with a single dashboard. It's earned through transparency, collaboration, and shared goals. The friction between sales and marketing almost always comes down to both teams looking at different data and using different definitions.
Start by creating a shared dashboard that shows metrics both teams care about, like the Lead-to-Opportunity conversion rate or the sales cycle length by channel. Crucially, you have to get sales in the room when you define what a ‘Marketing Qualified Lead’ (MQL) actually is.
When the sales team sees that marketing’s data is clean, reliable, and genuinely helps them prioritize their time to close deals faster, they won't just trust it—they'll start demanding it.
Ready to move from theory to action? Altior & Co.'s 6-Week Revenue Growth Sprint applies these data-driven frameworks directly to your business, uncovering hidden revenue leaks and building a blueprint for predictable growth. Expect a 15-25% improvement in pipeline velocity within 6 weeks.
Learn how the 6-Week Revenue Growth Sprint applies this framework to your business.