Unlock predictable revenue with our guide to marketing analytics. Learn the B2B SaaS metrics, models, and frameworks that turn marketing data into growth.
Marketing analytics is the system that connects every single thing your marketing team does to a real business outcome. It’s about moving past vanity metrics like social media likes and website clicks to answer the one question that matters for any B2B SaaS company: What's actually working to generate revenue?
Without a clear system, you're flying blind, making budget decisions based on gut feelings instead of cold, hard data. This guide provides a step-by-step framework to build a marketing analytics engine that shows you what’s actually working, so you can stop guessing and start scaling predictably.
Why Marketing Analytics Is Your Revenue Engine

A man presents a marketing dashboard on a large screen to two colleagues in an office.
Think of your company as a high-performance race car. Old-school marketing metrics are like the speedometer—they tell you how fast you feel like you're going (e.g., lead volume is up!). But proper marketing analytics is the entire diagnostic system. It shows you fuel efficiency (Customer Acquisition Cost), engine health (conversion rates), and the fastest route to the finish line (predictable revenue).
Without it, you’re just flooring the gas pedal and hoping you end up somewhere profitable.
Most B2B SaaS companies are running on a chaotic mess of disconnected data. You have Google Analytics over here, your CRM over there, and a dozen ad platforms in another corner. Nothing talks to each other, making it impossible to see the full customer journey. As a result, you might be celebrating a huge spike in Marketing Qualified Leads (MQLs), but the real data shows a terrifyingly low lead-to-close rate. That means sales is wasting precious time on prospects who were never going to buy. This is exactly where revenue leaks, silently draining your growth potential.
From Vanity Metrics to Revenue Metrics
The first step is shifting your focus from metrics that feel good to metrics that actually build the business. This table shows the difference between the noise and the signals that matter.
| Vanity Metric (What You Might Track) | Revenue Metric (What You Should Track) |
|---|---|
| Website Traffic & Page Views | Pipeline Sourced by Marketing |
| Social Media Likes & Followers | Customer Acquisition Cost (CAC) |
| Number of MQLs Generated | MQL-to-SQL Conversion Rate |
| Email Open & Click-Through Rates | Marketing-Influenced Revenue |
| Content Downloads & Form Fills | Customer Lifetime Value (LTV) |
This isn't just a change in what you report; it's a fundamental change in how you operate, forcing every decision to be tied to a revenue outcome.
Creating a Single Source of Truth
The ultimate goal of marketing analytics is to build a single source of truth. It’s about creating one unified view that draws a straight line from marketing spend to a closed-won deal. This clarity allows you to stop guessing and start making decisions based on cold, hard evidence. You can finally see which channels, campaigns, and content are your true growth drivers.
This data-first approach is rapidly becoming the standard. A Gartner study found that CMOs who successfully build an analytics function report 25% higher marketing ROI. This isn’t a small lift; it’s a significant competitive advantage driven by clarity.
From Disjointed Data to Actionable Insights
When your analytics are set up correctly, you can finally answer the questions that really matter:
- •Which marketing channel delivers customers with the highest Lifetime Value (LTV)?
- •How long is our average sales cycle, and where are deals getting stuck?
- •What was the actual ROI of our last big content marketing campaign?
Answering these requires more than just looking at numbers in a spreadsheet; it demands a connected system. To get a real-time pulse on customer behavior and market shifts, you have to move beyond static reports. You can dig deeper by exploring resources on Mastering Real-Time Data Analytics.
"The disconnect we see is often shocking. A marketing leader might report that 80% of MQLs are followed up on within 48 hours, but the CRM data reveals the reality is closer to four days. That two-day delay is where deals go to die. Marketing analytics doesn't just find this problem; it proves it needs to be fixed." - RevOps Expert
By tying marketing activities to real outcomes, you build a powerful feedback loop. This doesn't just prove marketing's value to the board; it gives your team the insights they need to get better every single week.
And while marketing analytics focuses on the top of the funnel, it’s just one piece of the puzzle. To see how it connects to the entire customer lifecycle, check out our guide on revenue analytics and get a complete picture of your growth engine.
The Core Metrics That Drive B2B SaaS Success
Once you’ve decided to build a marketing function that’s laser-focused on revenue, you have to learn to speak the right language. And that language is built on a handful of core metrics that tie every single marketing action directly to business growth. It's time to forget vanity metrics; these are the numbers that tell you if your SaaS business is actually healthy and built to scale.
These metrics cut through the noise and reveal the truth about your go-to-market engine. They answer the tough questions: "Are we acquiring customers profitably?" and "Is our sales pipeline moving fast enough to hit our numbers?" Let's break down the vitals you need to start tracking today.
Measuring Customer Economics
At the heart of any sustainable SaaS business, you’ll find two fundamental numbers: what it costs to land a customer and how much that customer is worth over their lifetime. Getting these two right is absolutely non-negotiable.
- •Customer Acquisition Cost (CAC): This is the total, all-in cost of your sales and marketing machine to acquire one new customer. You calculate it by dividing all your acquisition expenses—salaries, ad spend, tool subscriptions—by the number of new customers you brought in during that period. A rising CAC is a red flag that your growth engine is losing efficiency.
- •Customer Lifetime Value (LTV): This metric projects the total revenue you can realistically expect from a single customer account over the entire course of your relationship. It forces you to look beyond the initial sale and understand the long-term health of your customer base.
- •The LTV to CAC Ratio: This is the ultimate health score for your go-to-market strategy. It pits the lifetime value of a customer against the cost to acquire them. As a benchmark, HubSpot notes that a healthy LTV to CAC ratio for a growing SaaS business is at least 3:1. If you’re below that, you're likely spending too much to acquire customers who churn before they become profitable. To really get this crucial calculation down, check out our deep dive on the CLV to CAC ratio.
For instance, we helped Company X increase their trial-to-paid conversion from 12% to 18% in 6 weeks. Their marketing analytics revealed one of their main ad channels was bringing in low-LTV customers, tanking their ratio to a painful 1.5:1. By shifting that budget to channels that attracted higher-value customers, they boosted their overall LTV to CAC ratio to 3.8:1 within just two quarters.
Tracking Your Funnel's Health
Beyond customer economics, you need a clear view of how efficiently prospects are moving through your funnel. This is where you find the leaks that are silently killing deals. To get a real grip on how your campaigns are performing, a solid system for performance analytics for ads is non-negotiable.
Here are the key funnel metrics to keep on your dashboard:
- •Marketing Qualified Leads (MQLs): An MQL is a lead that marketing has flagged as being more likely to become a customer, based on their behavior and demographic data.
- •Sales Qualified Leads (SQLs): An SQL is an MQL that the sales team has reviewed and accepted as a legitimate, high-intent prospect worth their time. This handoff is a critical alignment checkpoint.
- •MQL-to-SQL Conversion Rate: This percentage reveals how many of your MQLs sales actually agrees with. A low rate (typically anything below 15-20%) is a classic sign of sales and marketing misalignment over what a "good lead" even looks like.
A classic scenario we diagnose is a marketing team celebrating a record MQL month while the sales team is complaining about terrible lead quality. The MQL-to-SQL conversion rate is the number that ends the argument and forces both teams to get on the same page.
Finally, Pipeline Velocity is the speedometer for your revenue engine. It measures how quickly deals move through your sales pipeline and turn into cash. By tracking these metrics, you stop flying blind and start making the precise, data-backed adjustments that actually accelerate growth.
Choosing the Right Marketing Attribution Model
Attribution is where most marketing analytics efforts fall apart. You’re pumping money into a dozen channels—paid ads, content, social media, events—but when a deal finally closes, who gets the credit? If your answer is "the last thing they clicked," you're making decisions with a massive blind spot.
Marketing attribution is the science of assigning credit to the marketing touchpoints that nudge a prospect along their journey to becoming a customer. The B2B buying journey isn't a straight line; it's a long, winding road with multiple stops. Relying on simplistic models is like giving the striker all the credit for a goal, completely ignoring the midfielders and defenders who made the play possible.
This concept map visualizes the core relationship between what it costs to get a customer (CAC) and what they're worth over their lifetime (LTV), which is precisely what good attribution helps clarify.
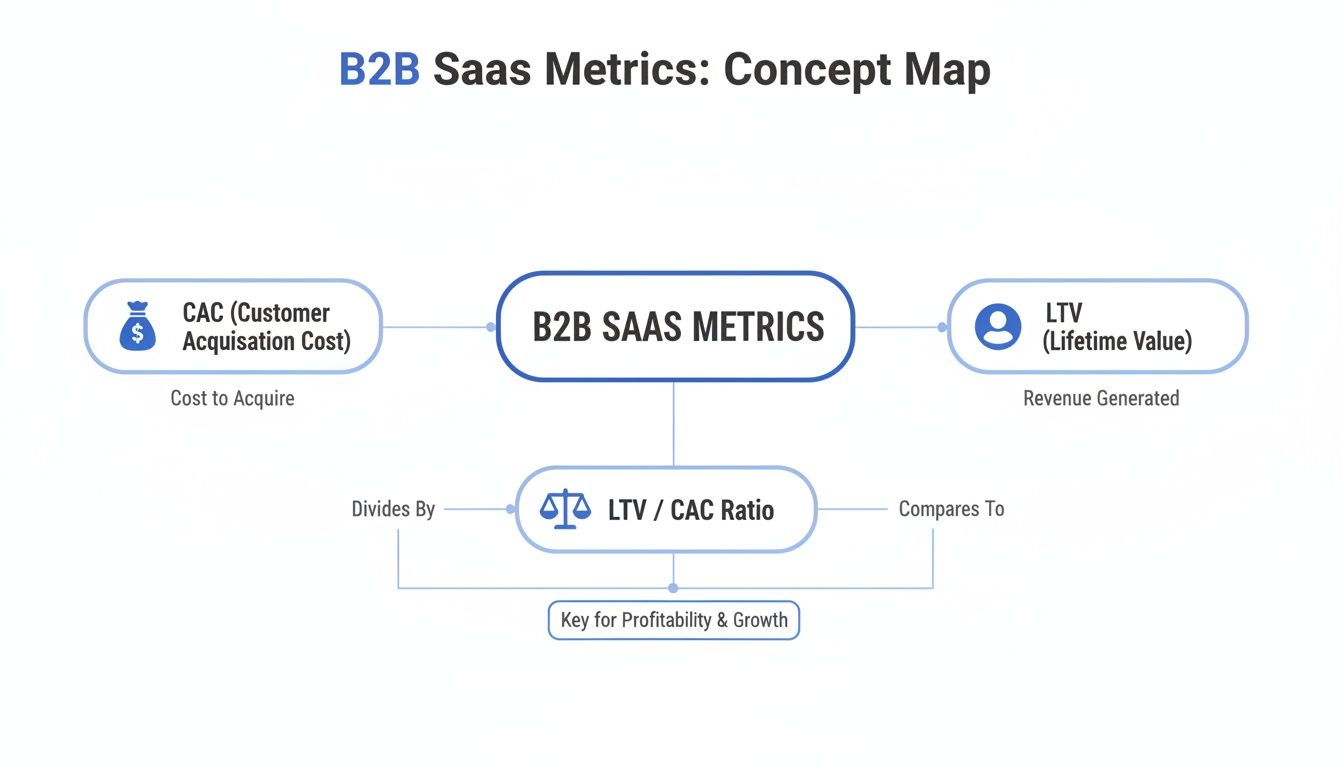
A concept map illustrating B2B SaaS metrics, showing Customer Acquisition Cost, Lifetime Value, and their ratio.
A healthy LTV:CAC ratio is the direct result of a well-understood and optimized customer journey. Attribution models are the tools that reveal that journey.
Why Single-Touch Models Fail B2B SaaS
Single-touch models, like First-Touch (giving 100% credit to the first interaction) or Last-Touch (crediting only the final click), are easy to set up but dangerously misleading. They paint a cartoonishly simple picture of a deeply complex process.
Imagine you only use Last-Touch. You might slash the budget for a top-of-funnel blog post that brought a prospect into your world six months ago, just because it wasn't the final click before they requested a demo. This is how you slowly starve the very channels that build awareness and trust over time.
Understanding Multi-Touch Attribution Models
Multi-touch models provide a much more balanced view by distributing credit across multiple touchpoints. They acknowledge that every interaction plays a role. Think of them as different ways to value each player on the team.
- •Linear Model: This is the most straightforward multi-touch model. It gives equal credit to every single touchpoint in the customer's journey. It’s a solid starting point if you want to move beyond single-touch but aren’t sure which interactions are most valuable yet.
- •U-Shaped Model: This model gives the most credit to two key moments: the first touch (awareness) and the lead conversion touch (the moment they became a lead). The rest of the credit is split among the interactions in between. Use this if you highly value both initial brand discovery and lead generation.
- •W-Shaped Model: Taking it a step further, the W-Shaped model highlights three key stages: the first touch, the lead conversion touch, and the opportunity creation touch. It’s ideal for longer sales cycles where the handoff from marketing to sales is a critical milestone.
The model you choose directly impacts your budget decisions. A U-Shaped model might lead you to invest more in top-of-funnel content, while a W-Shaped model could justify more spending on mid-funnel case studies that help create sales opportunities.
The Rise of Data-Driven Attribution
The most advanced approach is data-driven or algorithmic attribution. Instead of following a predefined rule, this model uses machine learning to analyze all converting and non-converting paths. It figures out how much credit each touchpoint truly deserves based on its actual influence. It’s the closest you can get to ground truth.
While building a custom algorithmic model can be complex, many modern analytics platforms now offer built-in versions. For a deeper look at how different models perform in the real world, check out our detailed attribution model case study.
Choosing the right model is a foundational step. Moving from a simple last-click model to a more nuanced approach is the first real step toward making smarter, revenue-focused marketing decisions.
Building Your Marketing Analytics Tech Stack

A laptop displaying 'Analytics Tech Stack' on a wooden desk with a data flow diagram on the wall.
Having the right metrics and attribution models is a great start, but they're just theory without the right systems to bring them to life. Your tech stack is the engine that collects, organizes, and presents your marketing data, turning a mess of disconnected numbers into a clear story about revenue.
The goal isn't just to buy more tools; it's to build a single, connected system that reveals the truth about what drives growth. So many companies make the mistake of buying expensive software without a clear strategy, which only creates more data silos, not fewer.
A modern marketing analytics stack is built in distinct layers, each with a specific job. Think of it like a factory assembly line for your data.
The Four Layers of a Modern Stack
Your stack doesn't need to be overly complicated, but it absolutely needs to be logical. Each layer feeds into the next, creating a smooth flow from raw, messy data to actionable insight.
- •
Data Collection: This is where it all begins. Tools in this layer capture user interactions from your website, app, CRM, and ad platforms. Think of tools like Segment or Google Tag Manager as the workers collecting raw materials from different suppliers. They ensure everything is gathered consistently before it moves down the line.
- •
Data Warehousing: All that raw data needs a home. A data warehouse like Google BigQuery or Snowflake acts as your central storage facility. It’s a clean, organized space where data from every single source is stored, making it accessible for analysis instead of being trapped in individual tools.
- •
Data Transformation: Let's be honest, raw data is often messy and inconsistent. The transformation layer, powered by tools like dbt (Data Build Tool), cleans, models, and prepares the data for analysis. This is the magic step where you join your ad spend data with your CRM data to finally calculate your true Customer Acquisition Cost (CAC) for each channel.
- •
Data Visualization: This is the final step where your clean, transformed data becomes dashboards and reports your team can actually use. Tools like Tableau or Looker Studio are your factory’s quality control and reporting department, presenting the finished product—clear insights—to your leadership team.
The core philosophy here is simple but powerful: The goal isn't more tools, but a single, connected system that reveals the truth about what drives revenue. A disjointed stack tells you conflicting stories; a unified stack tells you one true story.
Choosing the Right Stack for Your Stage
You don't need to build a massive, enterprise-level stack from day one. That's a classic mistake. Your technology should match your company's stage of growth, because over-investing too early is just as dangerous as waiting too long.
The Starter Stack (For Early-Stage Companies)
If you're just getting started, you can build a powerful yet cost-effective stack. The focus here is on nailing the fundamentals without breaking the bank.
- •Collection: Google Tag Manager (Free)
- •Warehousing: Google BigQuery (Generous free tier)
- •Transformation: dbt Core (Open-source and free)
- •Visualization: Looker Studio (Free)
This setup provides a rock-solid foundation for building a single source of truth without significant upfront investment. It allows you to start tracking key metrics and understanding your customer journey from the very beginning.
The Scaling Stack (For Growth-Stage Companies)
As your data volume and complexity explode, you’ll need more robust tools to handle the load and deliver deeper insights.
- •Collection: Segment or RudderStack
- •Warehousing: Snowflake or an upgraded BigQuery plan
- •Transformation: dbt Cloud
- •Visualization: Tableau or Looker
This advanced setup is built to handle the demands of a scaling business that relies on data to make critical go-to-market decisions. It enables more complex data modeling, better governance, and more sophisticated visualizations. The key is to build a system that prevents data chaos before it starts, ensuring your marketing analytics can keep pace with your growth.
A 4-Step Roadmap to Implementing Marketing Analytics
Theory is great, but execution is what puts money in the bank. Moving from a messy collection of spreadsheets to a clean, automated marketing analytics system can feel like a monumental task. The big question is always: where do you even begin?
This isn't an academic exercise. It's a practical, four-step roadmap we've used to guide companies from data chaos to revenue clarity. Think of it as your playbook for building a marketing engine that actually drives growth, one manageable step at a time.
Step 1: Diagnose Your Current State
Before you can build anything new, you need a brutally honest assessment of where you are right now. This initial audit is the most critical phase because it exposes the painful gaps between what your team thinks is happening and what the data actually shows.
Most companies we work with are shocked by what they find here. For instance, a sales leader might confidently claim 80% follow-up on all MQLs, but a quick look at the CRM data reveals the real number is closer to a dismal 25%. That gap? That's where your revenue is leaking out.
Timeline: Weeks 1-2
Your only goal here is to map out your existing data, tools, and processes—the good, the bad, and the ugly.
- •Action Checklist:
- •Data Audit: Hunt down all your marketing data sources. Think Google Analytics, your CRM, ad platforms, and marketing automation tools.
- •Tool Inventory: Make a list of every tool in your tech stack and what it’s supposed to do.
- •Process Mapping: Whiteboard the current journey of a lead, from the very first touchpoint to a closed deal. Get messy.
- •Stakeholder Interviews: Sit down with sales and marketing leaders. Ask them one simple question: "What's your biggest reporting headache?"
Step 2: Define What to Measure
With a clear picture of your starting point, the next step is to define what “good” actually looks like. This is where you move beyond vanity metrics (like impressions and clicks) and lock in the core KPIs that directly tie marketing activity to revenue. This is also when you have to choose a marketing attribution model that reflects how your customers actually buy.
Timeline: Weeks 3-4
This phase is all about creating focus and getting sales and marketing to finally speak the same language.
- •Action Checklist:
- •Establish Core KPIs: Pick 3-5 primary metrics to obsess over. Good starters are CAC, LTV, and MQL-to-SQL Conversion Rate.
- •Choose an Attribution Model: Don't overcomplicate it. Start with a simple multi-touch model like Linear or U-Shaped. You can get fancier later.
- •Create a Measurement Plan: Write down exactly how each KPI will be calculated, where the data comes from, and who owns it. No ambiguity allowed.
- •Set Initial Benchmarks: Do some digging on industry standards and set realistic first-pass targets for your KPIs.
Step 3: Automate Data Collection and Reporting
Pulling reports manually is a recipe for burnout, mistakes, and misery. The goal here is to build the technical foundation that automatically pulls data from all your sources into one centralized dashboard. This is where your tech stack finally starts working for you, not against you.
This step ends the weekly fire drill of pulling numbers from ten different logins. Instead, you get a single source of truth that’s always up-to-date—one that everyone from the CEO to the marketing coordinator can actually trust.
Timeline: Weeks 5-8
This is the most technical part of the journey, where you focus on getting your systems to talk to each other.
- •Action Checklist:
- •Implement Your Tech Stack: Connect your data sources to a data warehouse using a tool like Segment.
- •Build Data Models: Use a transformation tool like dbt to clean and prep your raw data, turning it into tables ready for analysis.
- •Create Your Master Dashboard: Use a visualization tool like Looker Studio or Tableau to build your primary marketing dashboard.
- •Validate the Data: Run tests to make sure the numbers in your shiny new dashboard actually match what the source platforms say. Trust, but verify.
Step 4: Optimize Based on Insights
Your analytics system is live. Congrats. But the work isn't over—it's just beginning. The final, ongoing step is to build a rhythm of reviewing the data and, most importantly, acting on it.
Data that doesn't lead to a decision is just expensive noise. This operational rhythm is what turns analytics from a backward-looking reporting function into a forward-looking strategic advantage. It's happening everywhere—the Middle East and Africa retail analytics market, for example, was valued at USD 1.26 billion in 2025 and is set to more than double to USD 2.79 billion by 2033. This explosion is driven by companies using data to act, with AI-powered personalization leading to a 22% lift in customer retention. You can get more insights on the regional retail analytics market here.
Timeline: Ongoing
This is about creating a continuous feedback loop that drives real improvement.
- •Action Checklist:
- •Schedule Weekly Reviews: Put a recurring meeting on the calendar to review the master dashboard and talk about what the numbers are telling you.
- •Adopt the "One Metric That Matters" (OMTM) Framework: Each week, pick one specific metric and focus the team's energy on improving it.
- •Run Experiments: Use your data to form hypotheses and run A/B tests to improve performance.
- •Iterate and Improve: Continuously tweak your dashboards and processes based on what your team actually needs.
By following this structured roadmap, you can expect a 15–20% improvement in marketing ROI visibility within the first 90 days, turning your marketing analytics from a cost center into a predictable revenue driver.
Your 90-Day Implementation Timeline
To make this roadmap even more concrete, here’s a breakdown of what the first 90 days look like when you put these steps into action. This timeline turns a big project into a series of manageable sprints with clear deliverables.
| Phase | Timeline | Key Actions | Success Metric |
|---|---|---|---|
| 1. Diagnose | Days 1-14 | Audit data sources, map lead flow, interview stakeholders. | A complete map of the current data ecosystem and a prioritized list of reporting pain points. |
| 2. Define | Days 15-30 | Select KPIs, choose an attribution model, create a measurement plan. | A documented measurement plan with defined KPIs, signed off by marketing and sales leadership. |
| 3. Automate | Days 31-60 | Connect data sources to warehouse, build data models, create master dashboard. | A live, validated master dashboard that automatically pulls and displays core KPIs. |
| 4. Optimize | Days 61-90 | Establish weekly review cadence, run first experiments, refine dashboards. | At least three data-driven decisions made that directly influence marketing strategy or tactics. |
Following this timeline doesn't just get you a dashboard; it builds the operational muscle needed to use data effectively. Within one quarter, you'll move from guessing to knowing, transforming your marketing function into a well-oiled, revenue-focused machine.
Common Marketing Analytics Pitfalls to Avoid

A woman reviews charts and data on a laptop screen, with 'COMMON PITFALLS' text overlay.
Getting marketing analytics right is one of the highest-impact projects you can run. But the road from data chaos to revenue clarity is paved with common, expensive mistakes. Just buying tools and building dashboards won't cut it.
Frankly, knowing what not to do is just as important as knowing what to do. Avoiding these traps is the difference between building a costly reporting function and engineering a genuine revenue machine. Let's walk through the mistakes we see B2B SaaS companies make time and time again.
Pitfall 1: Dirty Data
Making big decisions on bad information is far more dangerous than using no data at all. "Dirty data" is the direct result of inconsistent UTM tracking, duplicate CRM records, and a total lack of standard operating procedures. According to Salesforce, a jaw-dropping 91% of CRM data is incomplete, creating a cracked foundation for any analysis you try to build.
This isn't just a technical headache; it’s a massive business problem. When your data is a mess, you can't trust your attribution, your CAC calculations are fiction, and marketing and sales get locked in a perpetual finger-pointing war over lead quality.
The Fix: Get serious about data governance. Create a universal UTM guide everyone must follow and use automation to enforce clean data entry in your CRM. On top of that, schedule regular data cleanup sprints to merge duplicates and patch the holes.
Pitfall 2: Analysis Paralysis
You've got the dashboards. You’ve got the reports. But nobody is actually making any decisions. Welcome to analysis paralysis. It’s what happens when teams are so swamped with data that they freeze, failing to take any meaningful action.
Instead of hunting for insights, teams get stuck in an endless cycle of generating reports for the sake of reporting. The result? Hours are wasted staring at charts, but nothing in your go-to-market strategy ever changes.
The Fix: Use a "One Metric That Matters" (OMTM) framework for weekly reviews. Every week, the team focuses on moving a single, specific metric—like the MQL-to-SQL conversion rate. This forces a sharp, actionable conversation about what levers you can pull right now to move that one number.
Pitfall 3: Ignoring the Customer Journey
Too many teams fall into the trap of focusing only on the big, final conversion points—the demo request or the closed-won deal. This tunnel vision completely ignores the dozens of micro-interactions that happen before that last click. It leads to terrible budget decisions and a fundamental misunderstanding of what actually influences buyers.
A classic scenario we uncover is a company giving 100% of the credit to a single Google Ad, while completely ignoring the five blog posts, two webinars, and three case studies the prospect consumed over the previous six months. By ignoring the journey, they were actively starving the very content that built trust and educated their buyer in the first place.
Pitfall 4: Tool Overload
Buying shiny, expensive software without a clear strategy is the fastest way to burn cash and create chaos. It’s tempting to believe the sales pitch from the next hot tool promising to solve all your problems. But without a solid data architecture and a clear plan, you just end up with more data silos and a bloated, confusing tech stack.
Remember, the goal isn't more tools; it’s a single, connected system that gives you the truth.
The Fix: Start with your strategy, not the software. First, map out your ideal data flow and define the core business questions you need to answer. Only then should you look for tools that fit into that pre-defined architecture. Start lean and only add new tech when you’ve identified a specific, painful gap. This ensures your technology serves your strategy—not the other way around.
Frequently Asked Questions About Marketing Analytics
Diving into marketing analytics can feel like preparing to climb a mountain, but you don't need a Ph.D. in data science or a massive budget to get going. Here are the straight answers to the most common questions we hear from B2B SaaS leaders ready to trade guesswork for growth.
How Can We Get Started on a Small Budget?
You can actually build a surprisingly powerful marketing analytics foundation for practically nothing. The secret isn't expensive enterprise software; it’s about using free, robust tools that work well together to create a single source of truth.
A lean, high-impact stack to start with includes:
- •Google Analytics (GA4): The go-to for tracking exactly how users behave on your website and in your app.
- •Google Tag Manager: Lets you manage all your tracking scripts in one spot without having to pull in a developer for every little change.
- •Looker Studio (formerly Google Data Studio): Your free dashboarding tool. Use it to pull data from GA4 and Google Sheets into clean, automated reports.
This simple trio lets you centralize your core performance data, build basic attribution reports, and create a shared dashboard for sales and marketing—all for $0.
How Do We Get Sales and Marketing to Agree on the Data?
This is the million-dollar question, and the answer isn't a tool—it's a treaty. When sales and marketing can't agree on the numbers, it's almost always because they haven't agreed on the definitions behind them. The fix is co-creating a Service Level Agreement (SLA).
Think of the SLA as a peace treaty for your revenue teams. It's a non-negotiable document that explicitly defines:
- •The exact criteria for a Marketing Qualified Lead (MQL). No more ambiguity.
- •The exact criteria for a Sales Qualified Lead (SQL).
- •The maximum time sales has to follow up on an MQL (e.g., within 2 hours).
- •The process for sales to disposition leads they reject, with clear reasons.
Once this is signed off, you build a single shared dashboard in a tool like Looker Studio that tracks these exact metrics. The data is no longer "marketing's numbers" or "sales' numbers"—it's simply the number, and both teams are held accountable to it.
How Long Until We See Results?
This isn’t an overnight fix. While you can get initial dashboards live in a few weeks, the journey from data chaos to revenue clarity is a phased process. Setting the right expectations is key to keeping everyone bought in.
You’ll find quick wins almost immediately—like discovering a lead routing issue that’s costing you deals. But the real, strategic value comes from building a rhythm of reviewing data and acting on it, which takes a full quarter to establish.
Here’s a realistic timeline:
- •First 30 Days: You'll finally get some real visibility into your data. Expect to uncover a few "aha!" moments and obvious leaks in your funnel that you can patch up quickly.
- •First 90 Days: You should have a trusted, automated master dashboard and a weekly rhythm for reviewing insights. By now, you'll be making your first few truly data-driven decisions.
- •6 Months and Beyond: Marketing analytics is now part of your company’s DNA. You're no longer just reporting on what happened last month; you’re using predictive insights to forecast and shape what happens next quarter.
At Altior & Co., we collapse this timeline. Our 6-Week Revenue Growth Sprint is designed to take you from data chaos to a clear, actionable Revenue Growth Blueprint. We expose the gaps between perception and reality and build the foundation for predictable growth, fast. Learn how we apply this framework to find and fix the revenue leaks in your business.